CTL, ATL, TSB and ACWR, explained on my own season
What fitness, fatigue, form and the workload ratio mean, where they come from, and where they stopped making sense in nine months of my training and racing.
- Studies reviewed
- Own training data
- AI-assisted, author-checked
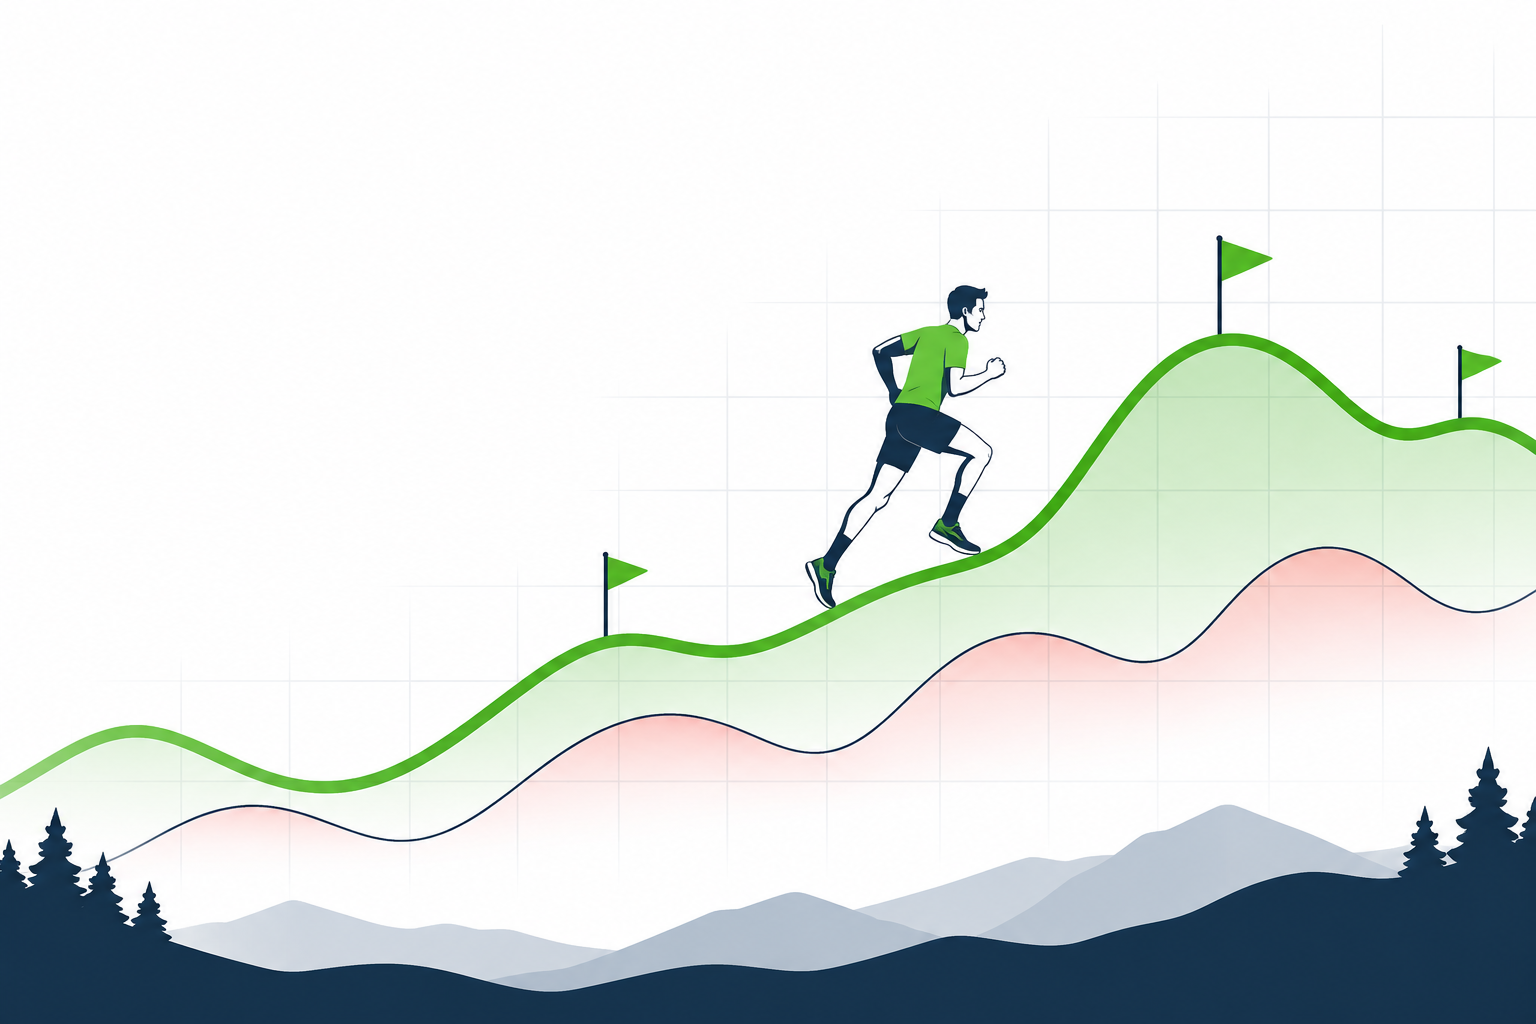 Fitness, fatigue and races across a season. (AI-generated illustration)
Between February and November 2026 I logged 320 activities, counting each triathlon leg on its own, and about 390 hours: road and trail running, cycling, swimming, hiking in the mountains, some strength work. I raced a lot: a 10 km, two marathons, three trail ultras from 56 to 113 km, three triathlons, a half marathon as a pacer.
I also wrote the software that turns those activities into numbers. Garmin MCP is an unofficial, open-source MCP server that lets an AI assistant answer questions from your Garmin Connect data. The numbers are computed on my machine, and every formula, default and limit is on one documentation page.
Here is what each number tells you, which published work it comes from, and where it got my season wrong. These are training metrics, not medical advice.
One number per session: training stress
Everything below starts from Training Stress Score (TSS): one number per session on a scale where an hour at your threshold is 100. Because every sport uses the same scale, a ride, a run and a swim add up in one daily total.
Each session takes the best measurement it has, in this order:
- Power for rides: normalized power against FTP, the classic TSS (Allen, Coggan and McGregor).
- Grade-adjusted pace for runs, against threshold pace (rTSS, after McGregor).
- Swim speed against critical swim speed, cubed, because drag grows fast with speed (sTSS).
- Heart rate, scored from the time in each heart-rate zone (hrTSS, as TrainingPeaks describes it, with Friel's TSS per hour by zone).
- Your own rating of the session (session RPE, Foster), only when nothing was measured.
In my season 119 sessions were scored from pace, 40 from power and 161 from heart rate: hikes, strength, a few runs, two triathlon bike legs, the transitions, and every swim, because I never recorded a critical swim speed.
A triathlon is saved as one multisport activity, so it is scored by its legs: the swim, the bike, the run and both transitions each count as an activity of their own sport. My three triathlon days came to 233, 238 and 309 TSS.
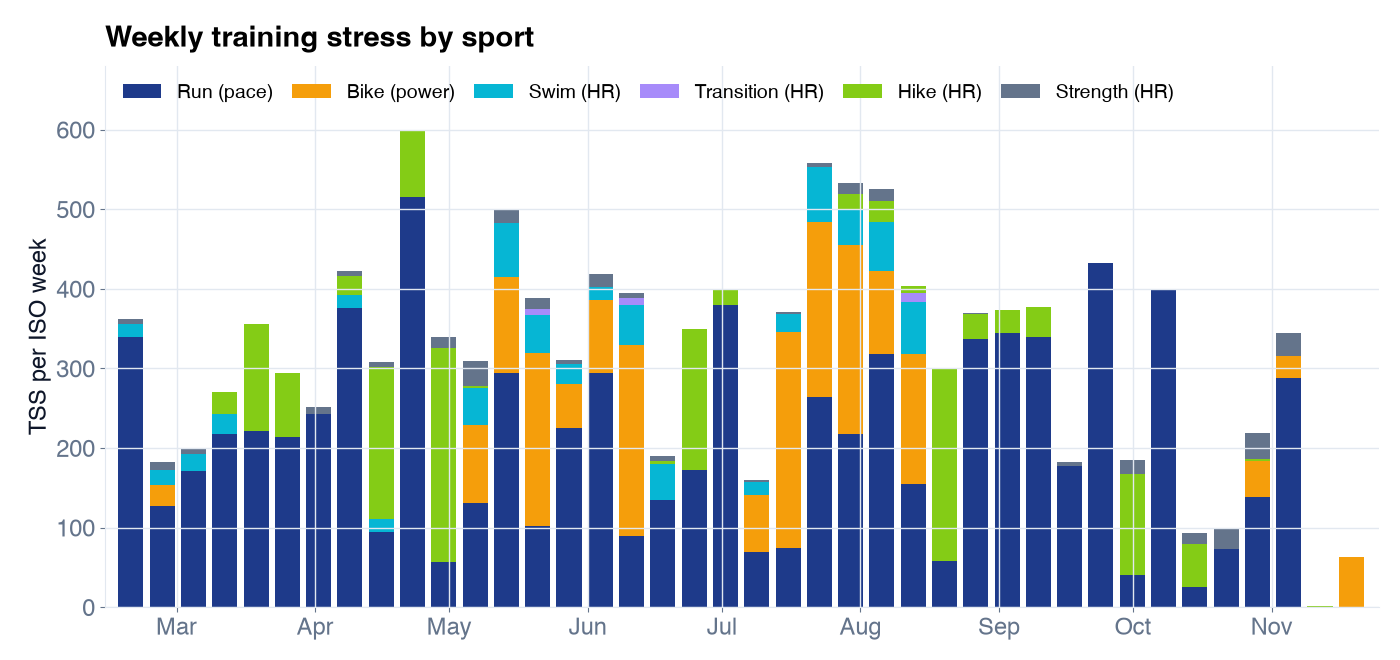 Weekly TSS by sport. The labels say which measurement scored most sessions of each sport. Triathlon weeks include the swim, bike, run and transition legs.
Every number here depends on your thresholds, and thresholds change. Each one is stored with the date it applies from, so a session in March is scored with March's values. Over this season Garmin's own detection moved my running threshold heart rate between 167 and 176 bpm and my threshold pace between 4:14 and 4:27 per km, and each change was recorded as a new row. A field test recorded with set_threshold takes precedence on its date.
Fitness, fatigue and form
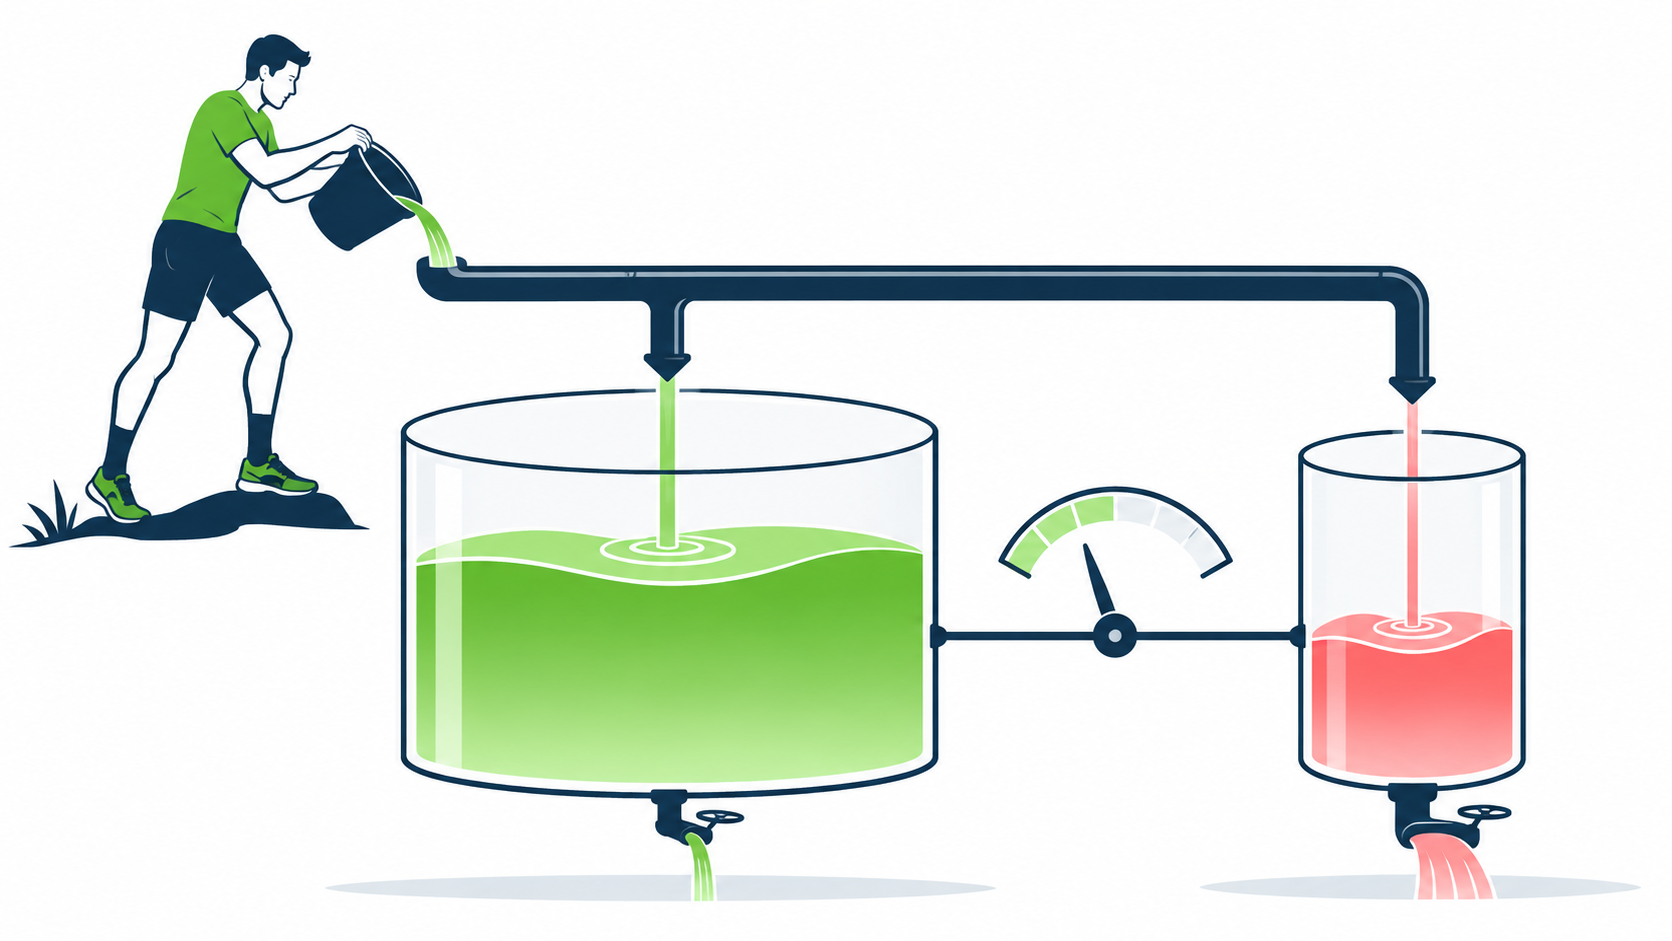 The fitness-fatigue model as two tanks. Every session fills both; the big one drains slowly, the small one quickly. Form is the difference between them. (AI-generated illustration)
The fitness-fatigue model goes back to Banister (1991), and it was popularised for power and pace training as the Performance Management Chart (Allen, Coggan and McGregor). It needs three lines:
- Fitness (CTL): your daily stress averaged over about 42 days, weighted toward recent days.
- Fatigue (ATL): the same over about 7 days.
- Form (TSB): fitness minus fatigue at the start of the day.
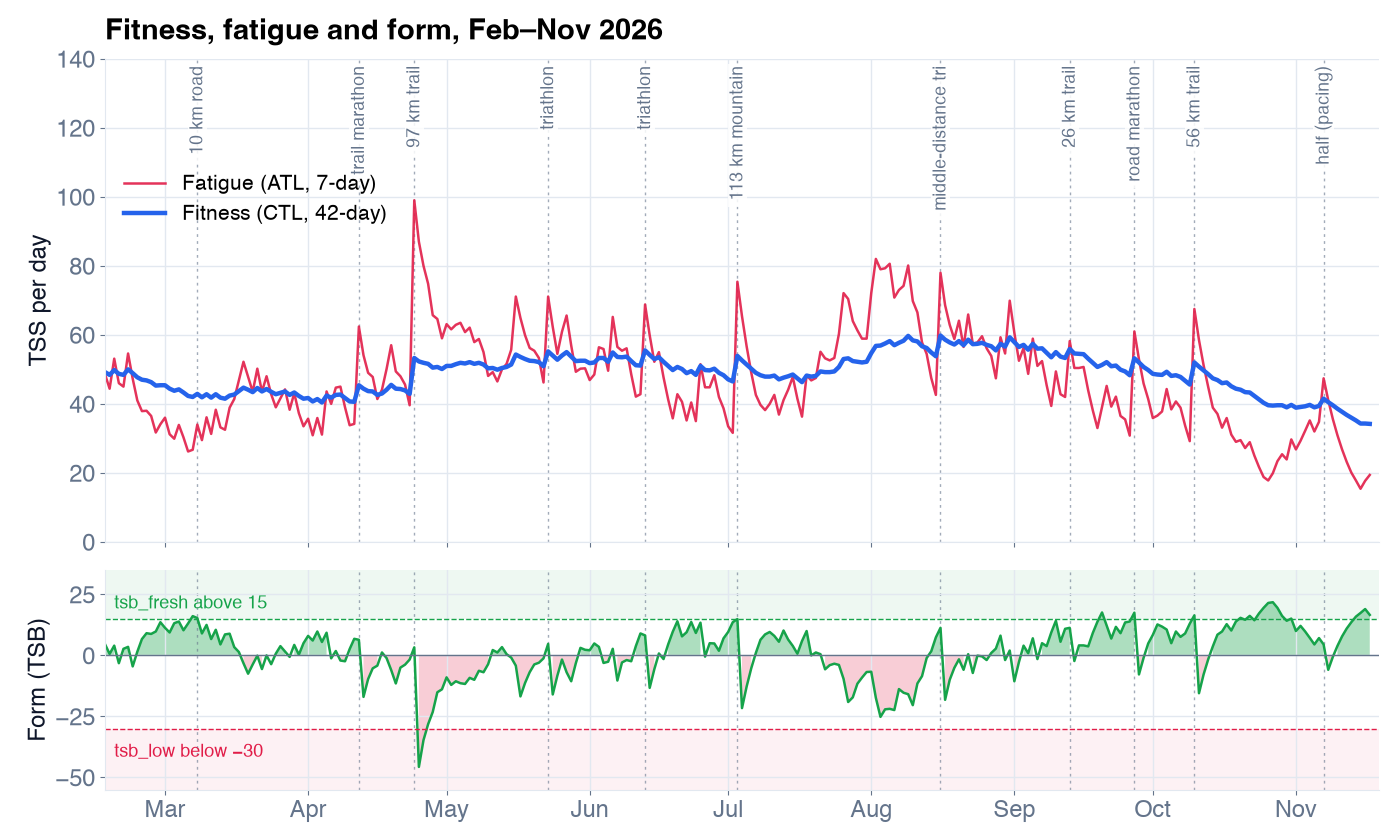 My fitness (blue), fatigue (red) and form (green) from 16 February to 17 November 2026. Dotted lines are races. The bands show the default flag levels.
My fitness reached 59.7 on 9 August, after three weeks of 526 to 558 TSS each, and peaked at 59.8 a week later with the middle-distance triathlon. The deepest form, −45.7, came the day after the 97 km trail race. On race mornings my form was between +3 and +18: fresh, without having lost fitness.
The model raises two flags by default: tsb_low below −30 (deep fatigue) and tsb_fresh above 15 (a taper or a break). Over these 275 days that was 2 and 18 days.
It needs about 42 days of history to settle; before that, form looks deeply negative after ordinary training, so those days are marked as warming up and the form flags stay off.
Acute:chronic workload ratio
ACWR divides your mean daily stress of the last 7 days by that of the last 28. Around 1 is what you are used to; well above 1 is a sudden jump; well below is a taper, a break or not enough training. It comes from research on training load and injuries, much of it in team sports (Gabbett 2016; Hulin et al. 2016).
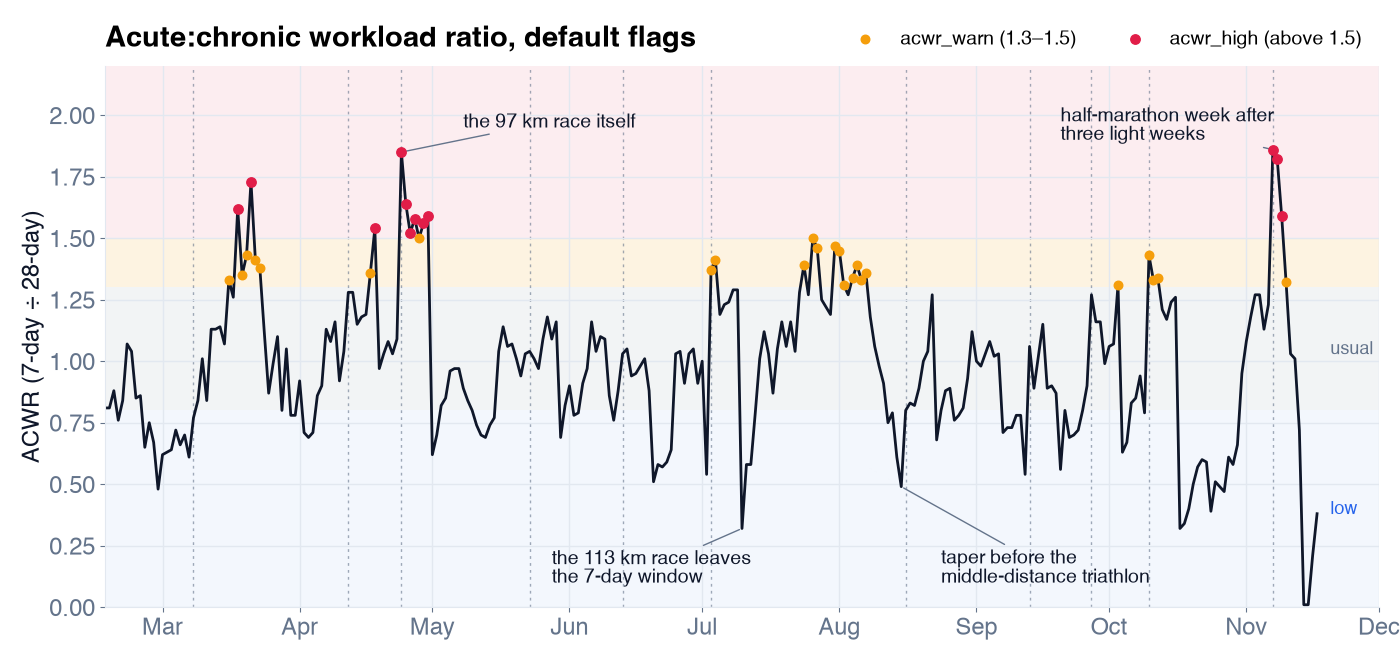 My ACWR with the default cut-offs: warning above 1.3, high above 1.5, low below 0.8. The dots apply those defaults to every day of the season.
With the defaults the ratio was above 1.5 on 12 days, between 1.3 and 1.5 on 24, and below 0.8 on 78. Read that way, more than a quarter of my season was "undertraining" and twelve days were a "load spike". Look at what the spikes actually were:
- 24 April, 1.85: the 97 km race itself. The week's load jumped because of one very long day I had prepared for.
- 7 November, 1.86: a half marathon I paced, in my first normal week after three light weeks of recovery from an ultra. The 28-day average was low, so ordinary training looked like a jump.
- The lows: tapers and recovery weeks around races. The ratio fell to 0.49 the day before the middle-distance triathlon, and to 0.32 a week after the 113 km race, when that one long day left the 7-day window.
This is what the critical review by Impellizzeri et al. (2020) warns about. The ratio has conceptual and statistical problems, among them that the last week is part of the four weeks it is divided by, and it should not be used to predict injuries. I read it as a prompt to ask "did my load jump, and did I mean it to?", nothing more.
The cut-offs are starting points, not fixed limits, and you can change them per question. For the November day, raising them turns the "high" flag into a "warning":
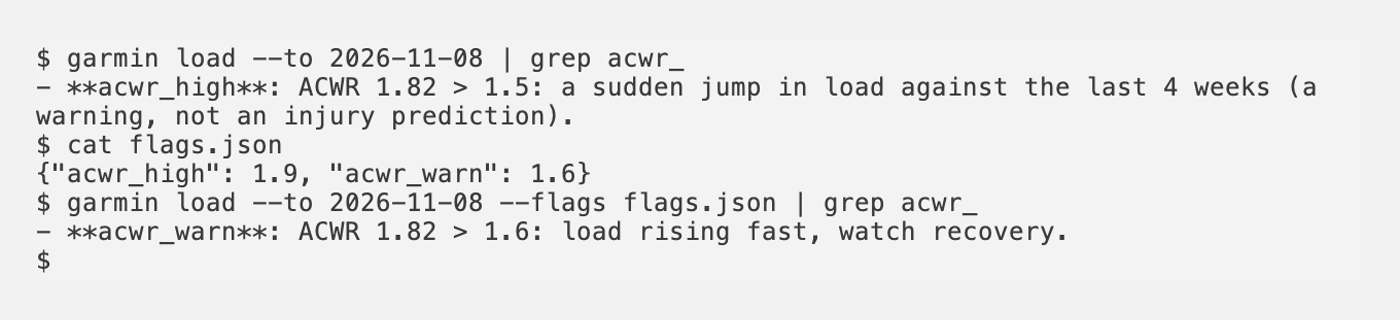 The same day with the default cut-offs and with my own.
garmin here is the command-line companion, npx -y garmin-mcp-cli.
Monotony and strain
Monotony is the mean daily load of the last 7 days divided by its standard deviation: high when every day carries about the same load. Strain is the week's total multiplied by monotony. Both come from Foster's work on monitoring training and overtraining (Foster 1998).
My highest monotony was 3.59 on 8 May: seven days in a row between 30 and 71 TSS, no rest day. Nothing about that week felt dramatic, which is the point of the metric. The default flag, 2.0, was raised on 9 days. One rest day lowers monotony sharply, by design. Read strain as a trend from week to week.
How the time splits across three zones
Seiler's review of intensity distribution (Seiler 2010) describes endurance athletes spending most of their time easy. The model splits your endurance time of the last 28 days into three zones: Z1 below the first lactate threshold (LT1), Z2 between LT1 and threshold heart rate, Z3 above it. The flag z1_below_target says when your easy share is below a target, 75% by default.
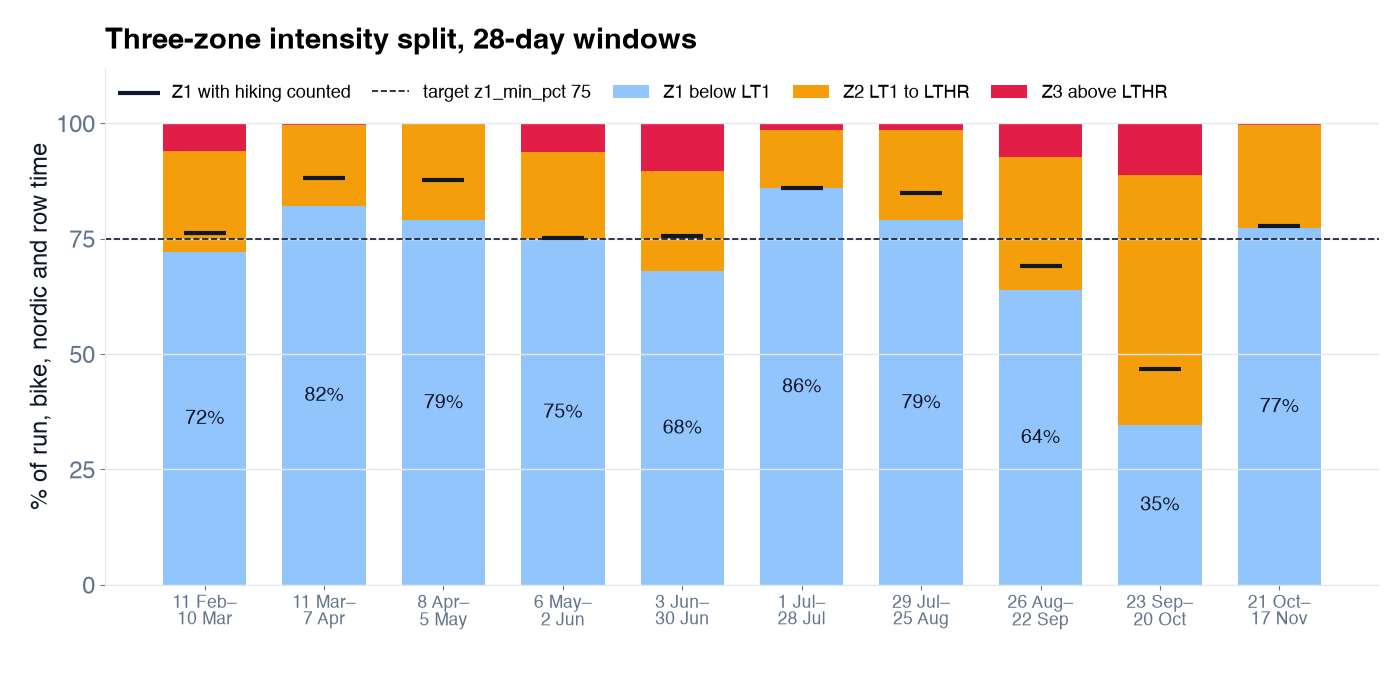 Running, cycling, cross-country skiing and rowing time per 28-day window. The black marks show the Z1 share when hiking is counted too.
Most of my windows had 72 to 86% of the time in Z1. Then 23 September to 20 October dropped to 35%. That window held a road marathon, a 56 km trail race and marathon-pace sessions, so some of it is real. Some of it is not: Garmin's threshold detection had moved my threshold heart rate down to 167–168 bpm, and since I never tested LT1, the model approximates it as 0.90 × threshold heart rate. A lower LT1 pushed easy runs into Z2. The split is only as good as your thresholds.
Hiking is left out by default. In mountain weeks that makes the easy share look low: from 8 April to 5 May my Z1 share was 79% without hikes and 88% with them. One flag, {"intensity_sports": ["run", "bike", "nordic", "row", "hike"]}, adds them.
Efficiency factor and decoupling
The efficiency factor (EF) is how much speed or power you get per heartbeat. It is computed only from easy sessions (below LT1, at least 30 minutes), so it reflects aerobic fitness rather than how hard a workout was. Aerobic decoupling compares EF in the first and second half of one long, steady session: if heart rate drifts up while pace stays the same, the second half was less efficient. Both are described for power and pace training by Allen, Coggan and McGregor; Maunder et al. (2021) call the ability to hold steady over long efforts "durability". Around 5% decoupling is a usual orientation point.
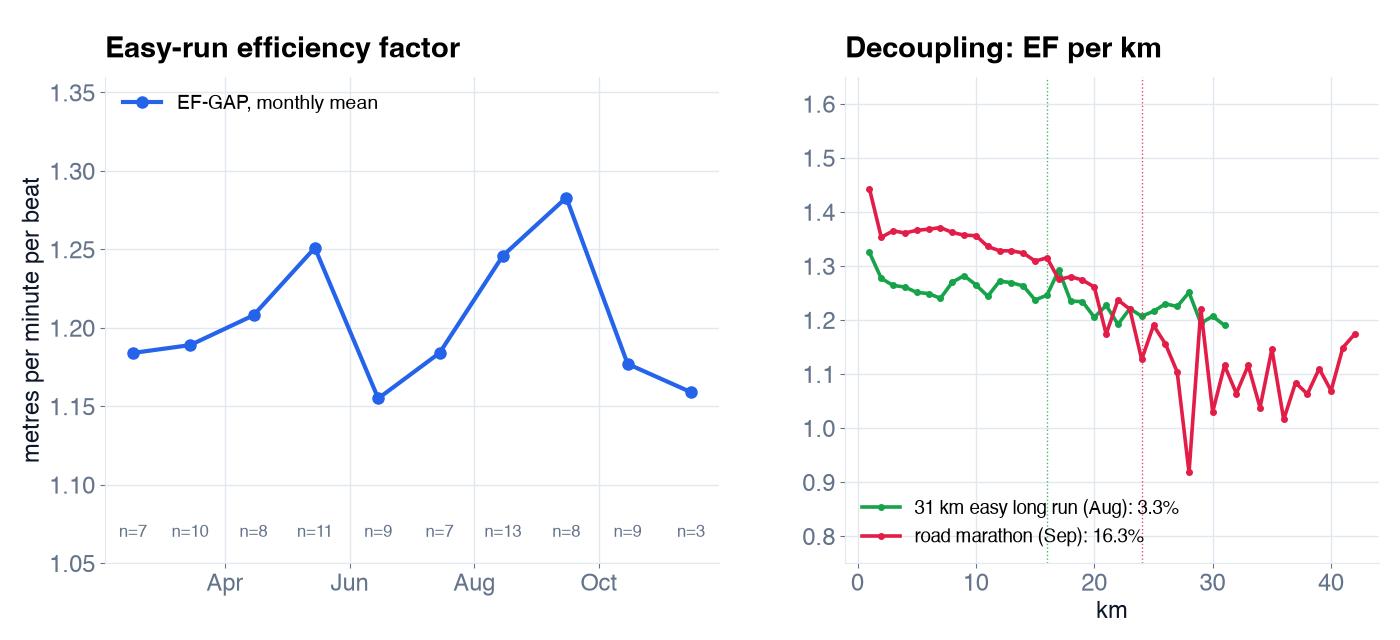 Left: EF of easy runs per month (grade-adjusted speed in metres per minute per beat; n is the number of runs). Right: EF per kilometre of two long runs; dotted lines mark half of the time.
My easy-run EF rose from 1.18 in February to 1.28 in September, then fell back after the racing ended. Treat the monthly points loosely: some months have few runs, and hills, heat and stops all move them.
Decoupling told the clearest story of the season. My two longest easy runs in August decoupled by 0.6% (23 km) and 3.3% (31 km). The road marathon in September decoupled by 16.3%: I held about 4:40 per km to halfway, then slowed to well over 5 minutes per km and walked parts of the last 15 km. The number does not explain why. It confirms that the second half was a different race from the first.
Decoupling needs the laps of an activity, so they have to be downloaded first (get_activity with detail: "splits"). Without them the field stays empty, and it is never a warning flag.
Asking the assistant
I rarely read these numbers as tables. I ask:
- "How fit and how fatigued am I, and what was my form before each race since February?"
- "Show my load from 1 August with the daily series. Use 1.6 as the ACWR warning level."
- "What share of my running and cycling time in the last 28 days was below LT1? Count hiking too."
- "How has my easy-run efficiency changed month by month this year?"
The assistant turns the second question into one call, roughly get_load with {"from": "2026-08-01", "include_series": true, "flags": {"acwr_warn": 1.6}}. Every answer returns the values it used in flags_used, and a key it does not know is ignored with a note rather than silently.
Limits
These are the places where the model got my season wrong, or could have.
- Mountain ultras read low from pace. My 113 km mountain race took 25 hours. Scored from grade-adjusted pace against my flat threshold pace, it was 361 TSS. Scored from heart rate, about 970. Neither is the truth, but power-hiking steep climbs with stops is not what threshold pace describes.
source: "hrtss"shows the heart-rate view of the whole season. - A second recording of a leg is left out. In two of my triathlons my bike computer recorded the bike leg next to the watch. An activity inside the race's time window is treated as a duplicate, so the leg counts once, but from the watch: by heart rate, because the power data was in the skipped recording.
- Approximated thresholds shift everything. My LT1 is 0.90 × threshold heart rate, not a test, and my swims have no critical swim speed. An outdated threshold moves every number in the same direction.
- One model for all sports. A cycling block raised my total CTL without preparing my legs for a hard run.
include_by_sport: trueadds a model per sport group. - It is a model of load, not of you. It says nothing certain about illness, injury or overtraining. If you feel unwell, talk to a doctor.
What I take from my charts is the shape, not the decimals: where the load rose, where I rested, and whether I arrived at races fresh. When a number looks wrong, the methods page shows why.
Sources
Full references are on the Training analytics page.
- Allen, Coggan, McGregor. Training and Racing with a Power Meter, 3rd ed., 2019.
- Banister. Modeling elite athletic performance, 1991.
- Foster. Monitoring training in athletes with reference to overtraining syndrome, 1998; Foster et al., 2001.
- Gabbett, 2016; Hulin et al., 2016; Impellizzeri et al., Acute:chronic workload ratio: conceptual issues and fundamental pitfalls, 2020.
- Seiler. What is best practice for training intensity and duration distribution in endurance athletes?, 2010.
- Maunder et al. The importance of "durability" in the physiological profiling of endurance athletes, 2021.
- TrainingPeaks articles on rTSS, hrTSS, estimating TSS and swimming TSS.
Code: https://github.com/endurancetools/garmin-mcp Documentation, including Methods and evidence and Training analytics: https://endurancetools.github.io/garmin-mcp/
Unofficial; not affiliated with or endorsed by Garmin.
Some illustrations in this article were generated with ChatGPT.
 Follow @marcin_running on Instagram