I checked 10,588 numbers my AI coach gave me. The copying was fine. The maths wasn't.
Three Claude models answered 50 training questions from my Garmin data, twice each. Of the numbers they copied from the tools, 2 in 10,009 were wrong. Of the ones they calculated themselves, 10 in 573.
- Own training data
- Code & method included
- AI-assisted, author-checked

Every number in an answer should lead back to a card it came from. (AI-generated illustration)
When my assistant tells me "your HRV was 27 ms, against 36 ms for the week", I tend to believe it. It sounds precise, and precision feels like evidence. But a language model can write a precise number that is not anywhere in my data, and I would not notice unless I went and looked.
I run, and I write software. Garmin MCP is my unofficial, open-source MCP server that lets an AI assistant answer questions about my Garmin Connect data. I wrote earlier that I built it to give "answers you can check": every analytics answer carries the values and the rules behind it. That is a promise about the server. This article is about the other half: what the model does with those values on the way to the answer. So I checked every digit in 300 answers.
The experiment
I wrote 50 questions the way I actually ask them, 23 in Polish and 27 in English: readiness ("Can I train hard today?"), form and load, sleep, health trends, single runs, comparisons, week and month summaries, thresholds and Garmin's training status. All of them are about training metrics; none about weight or body composition.
Each question went through claude -p (Claude Code 2.1.330) with the real server, built from the repository, and nothing else: no built-in tools, no settings, no other MCP servers, the default Claude Code system prompt and an empty working directory. The read tools were allowed, the write tools and garmin_sync were not. The server ran on a frozen copy of my local database with automatic downloads off and no sign-in, so every run saw the same data and nothing reached Garmin. The copy ends on 18 November; I asked on 21 November, so "today" and the last three days had no data, as happens after a few days without a sync.
Three models answered every question twice: Claude Opus 5.5, Sonnet 5.5 and Haiku 5.5. That made 300 answers. For each one I kept every tool call and its full result, which is what makes the check possible: a number in the answer is right only if it can be traced to those results.
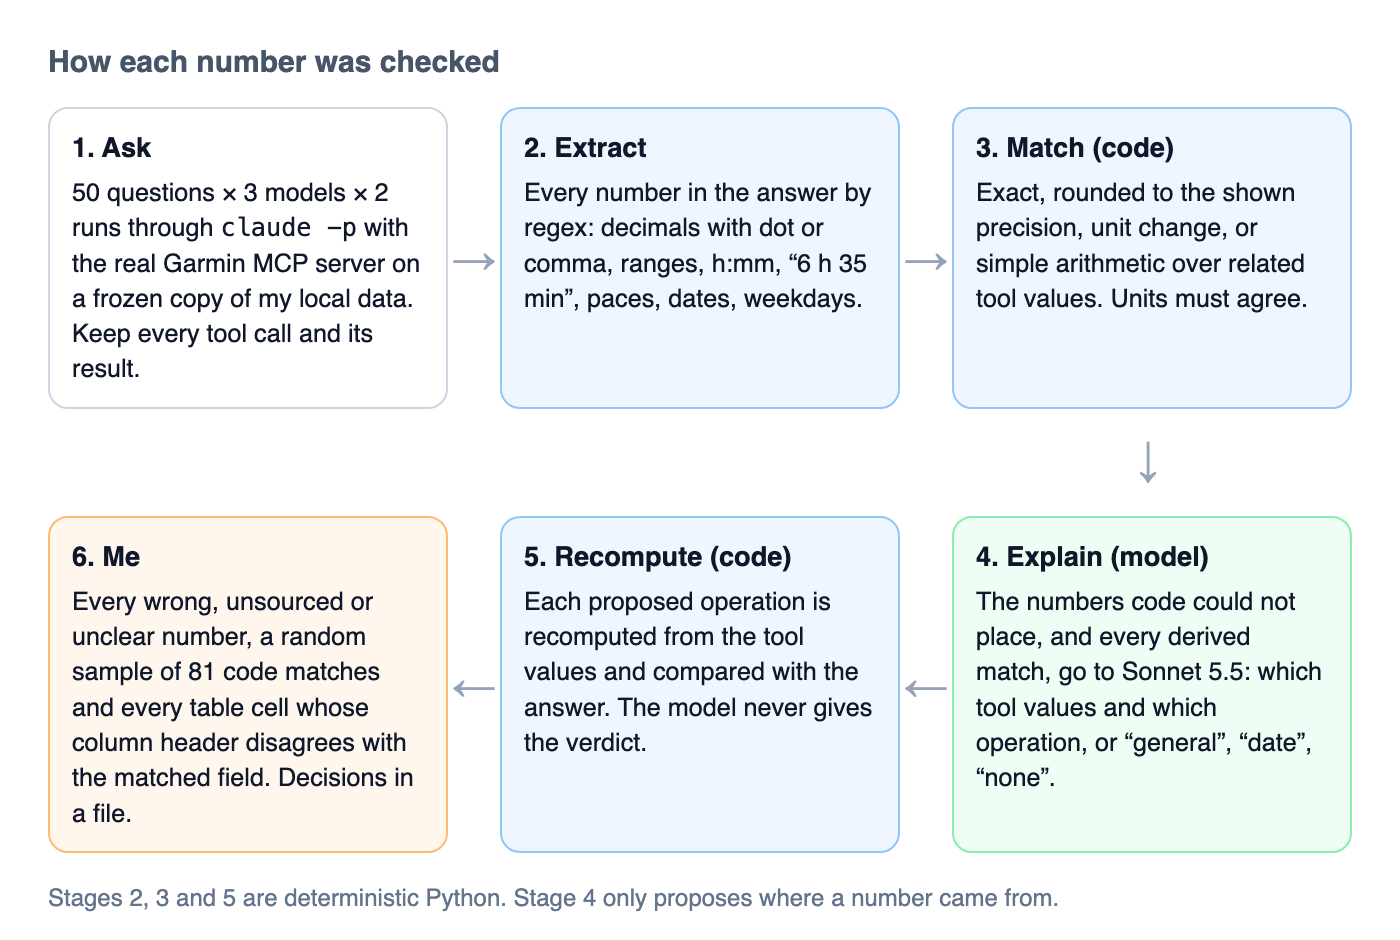
How each number was checked. The model in step 4 only proposes a source; code decides.
How a number gets checked
First, code pulls out every number in the answer: decimals with a dot or a comma, ranges like "33–42", durations like "7:10" and "6 h 35 min", paces, dates and weekdays. Then it looks for each one in the tool results of the same run:
- exact: the same value is there;
- rounded: a value there, rounded to the precision the answer shows ("58" for 58.1, "5:45" for 5:44:56);
- unit change: seconds to minutes or hours, metres to kilometres, a fraction to a percentage;
- calculated: a sum, difference, mean, ratio, percentage or count over related values, with units that agree.
Some numbers are not claims about my data at all: dates, zone and lap numbers, "28" in "28-day average", a number repeated from the question, and general advice such as "7 hours of sleep". I counted those separately and left them out of the rate.
What code could not place, plus every calculation it matched (calculations are where coincidences hide), went to a second stage. There Sonnet 5.5 read the tool results and the answer and said, for each marked number, which values it rests on and which operation, or that it was general knowledge, a date, or nothing at all. It did not decide whether the number was right. Code took the proposed operands, checked that each one exists in the tool results, recomputed the operation and compared it with the answer.
Then I looked myself at every number that came out wrong, unsourced or unclear, 214 of them, and wrote each decision into a file. I counted an error as minor when it was within 10% of the right value, as in "−103 km" for −102.3, and as material otherwise. To test the code matches, I checked a random sample of 81 by hand: all 79 quantities had the right value. A second check compared every number in a table with its column header. It found one wrong number the code had passed: a running TSS of "~560", matched to the calorie count of some activity. Its two neighbours in the same column had already failed in the second stage.
What came out
The 300 answers contained 13,323 numbers. 2,735 were dates, labels, echoes of the question or general advice. The remaining 10,588 were claims about my data, and those are the ones I checked.
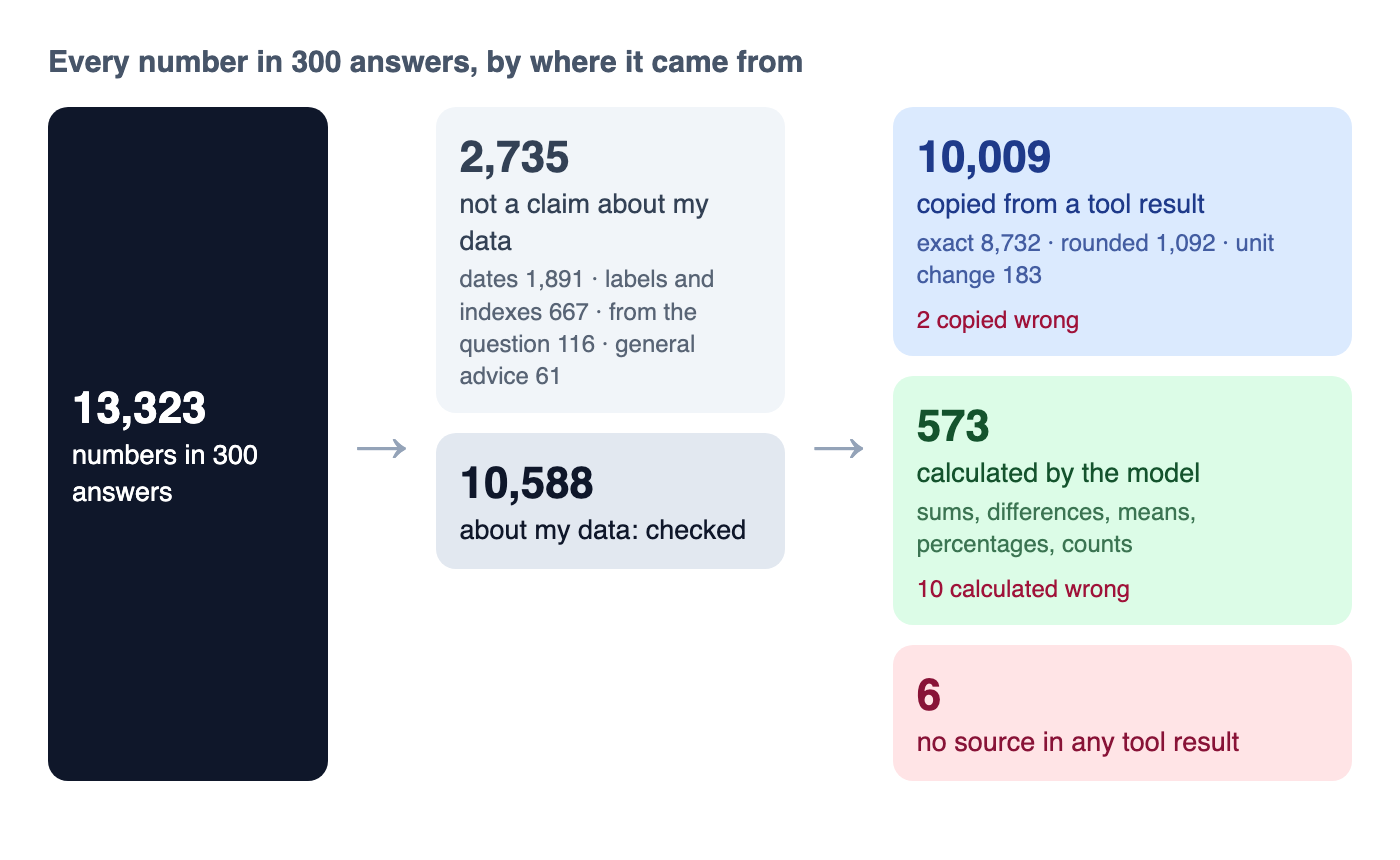
Where the numbers came from. Most were copied; about one in twenty was calculated.
10,570 of them were faithful: 99.8%. Eighteen were wrong. Two were copied wrong, ten were the model's own arithmetic, and six had no source at all, three of them openly labelled as the model's own estimate. Thirteen of the 300 answers contained at least one wrong number.
Here is what that looks like in one answer.
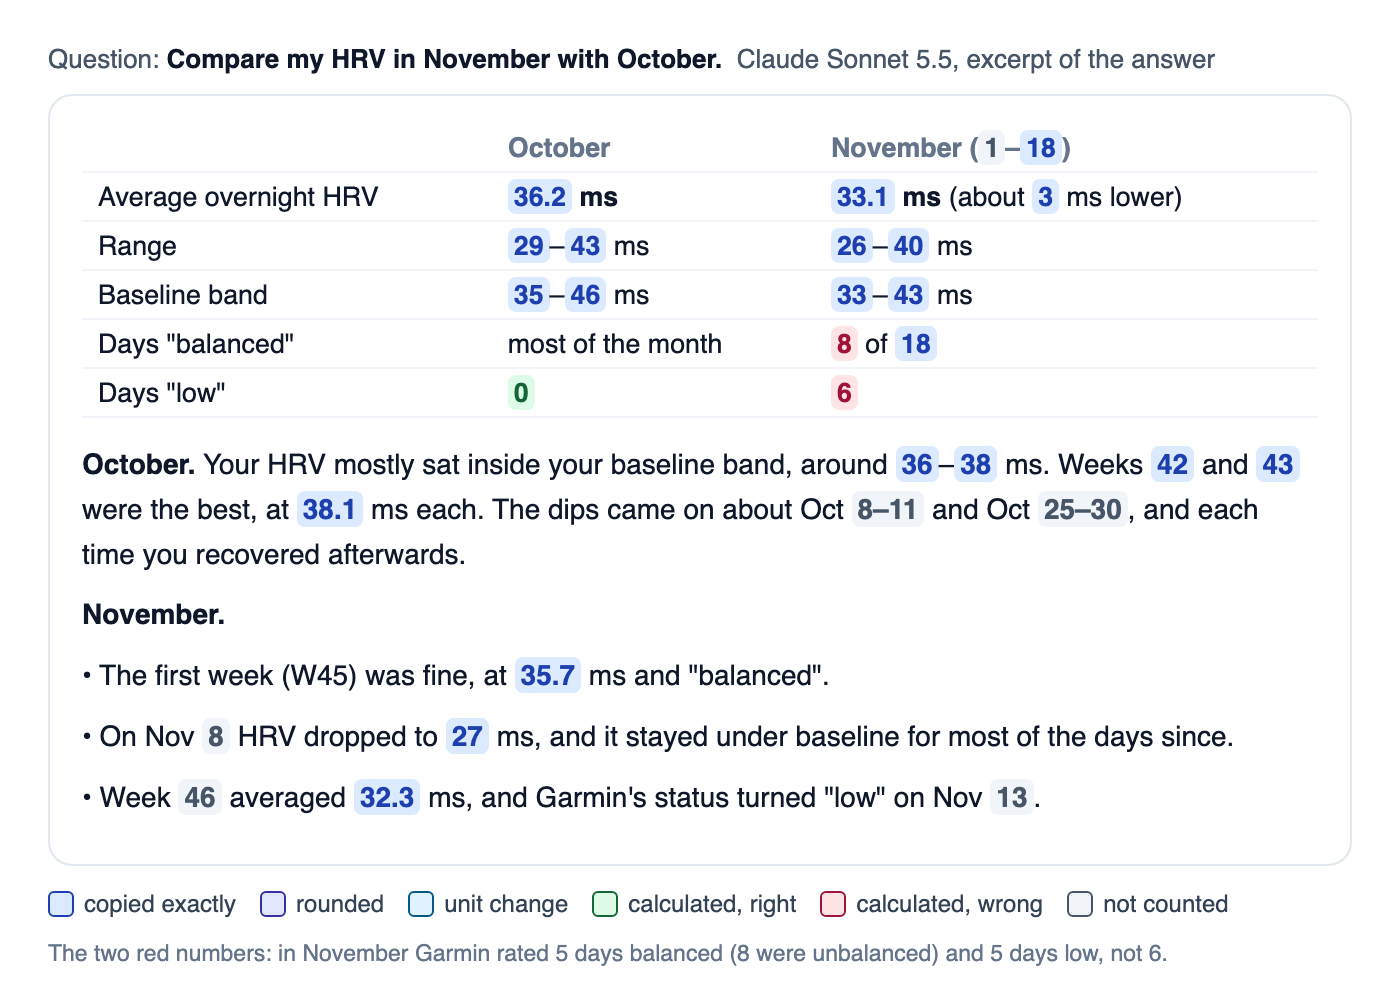
Sonnet 5.5 comparing two months of HRV. Every average, range and baseline is copied correctly. The two counts it made itself are wrong.
Copying is safe. Arithmetic is not.
The split between copied and calculated numbers is the main result.
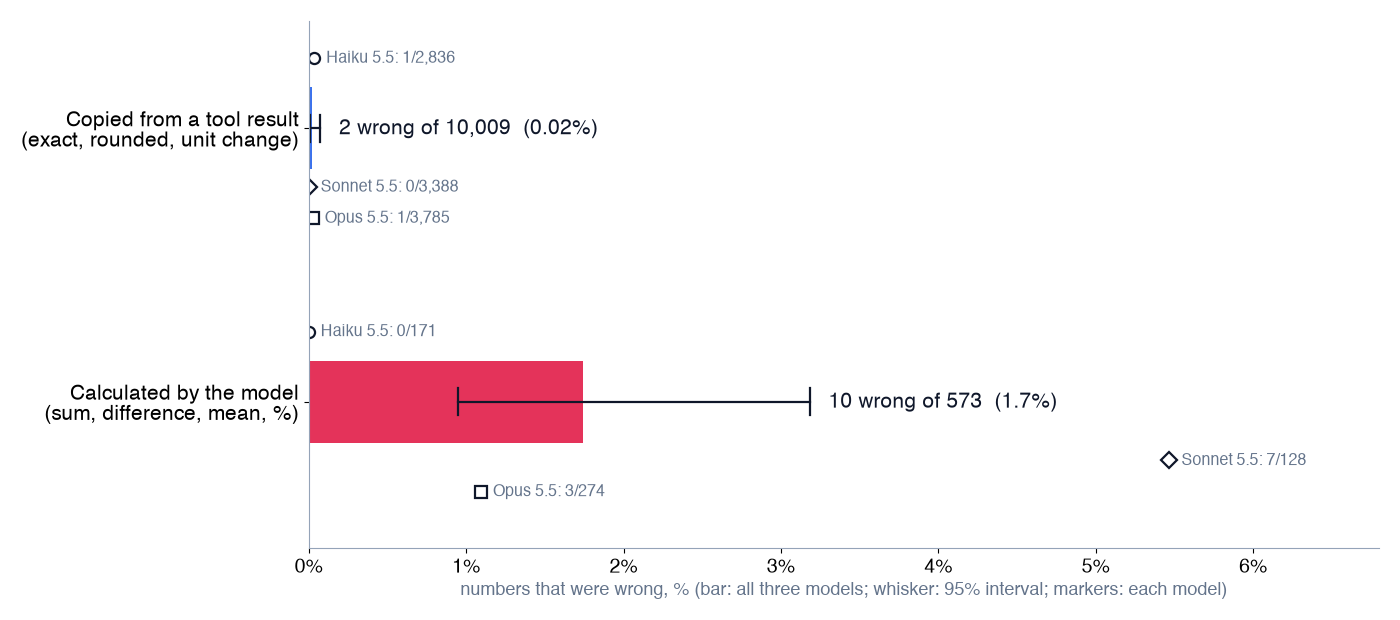
Wrong numbers among copied and calculated ones, all three models together and each on its own.
Of the 10,009 numbers the models copied, rounded or converted, two were wrong, and both were the same slip: a time stored in UTC, given as if it were local. Of the 573 they calculated, ten were wrong: 1.7%, about 90 times the rate for copying.
The calculations were ordinary: 169 differences, 157 sums, 87 percentages, 59 counts, 36 means and 36 ratios, mostly paces from time and distance. The great majority were right. Opus averaged my resting heart rate and HRV over the four weeks before my half marathon, Haiku worked out the efficiency of 16 runs from pace and heart rate, and all three summed running and trail running to compare October with September. When a calculation went wrong, though, nothing in the answer showed it.
I had run Sonnet and Haiku once before, a few days earlier, on an older version of Claude Code, with the same questions and the same method. That run gave the same picture: 1 wrong in 5,927 copied numbers and 10 wrong in 335 calculated ones.
The eighteen
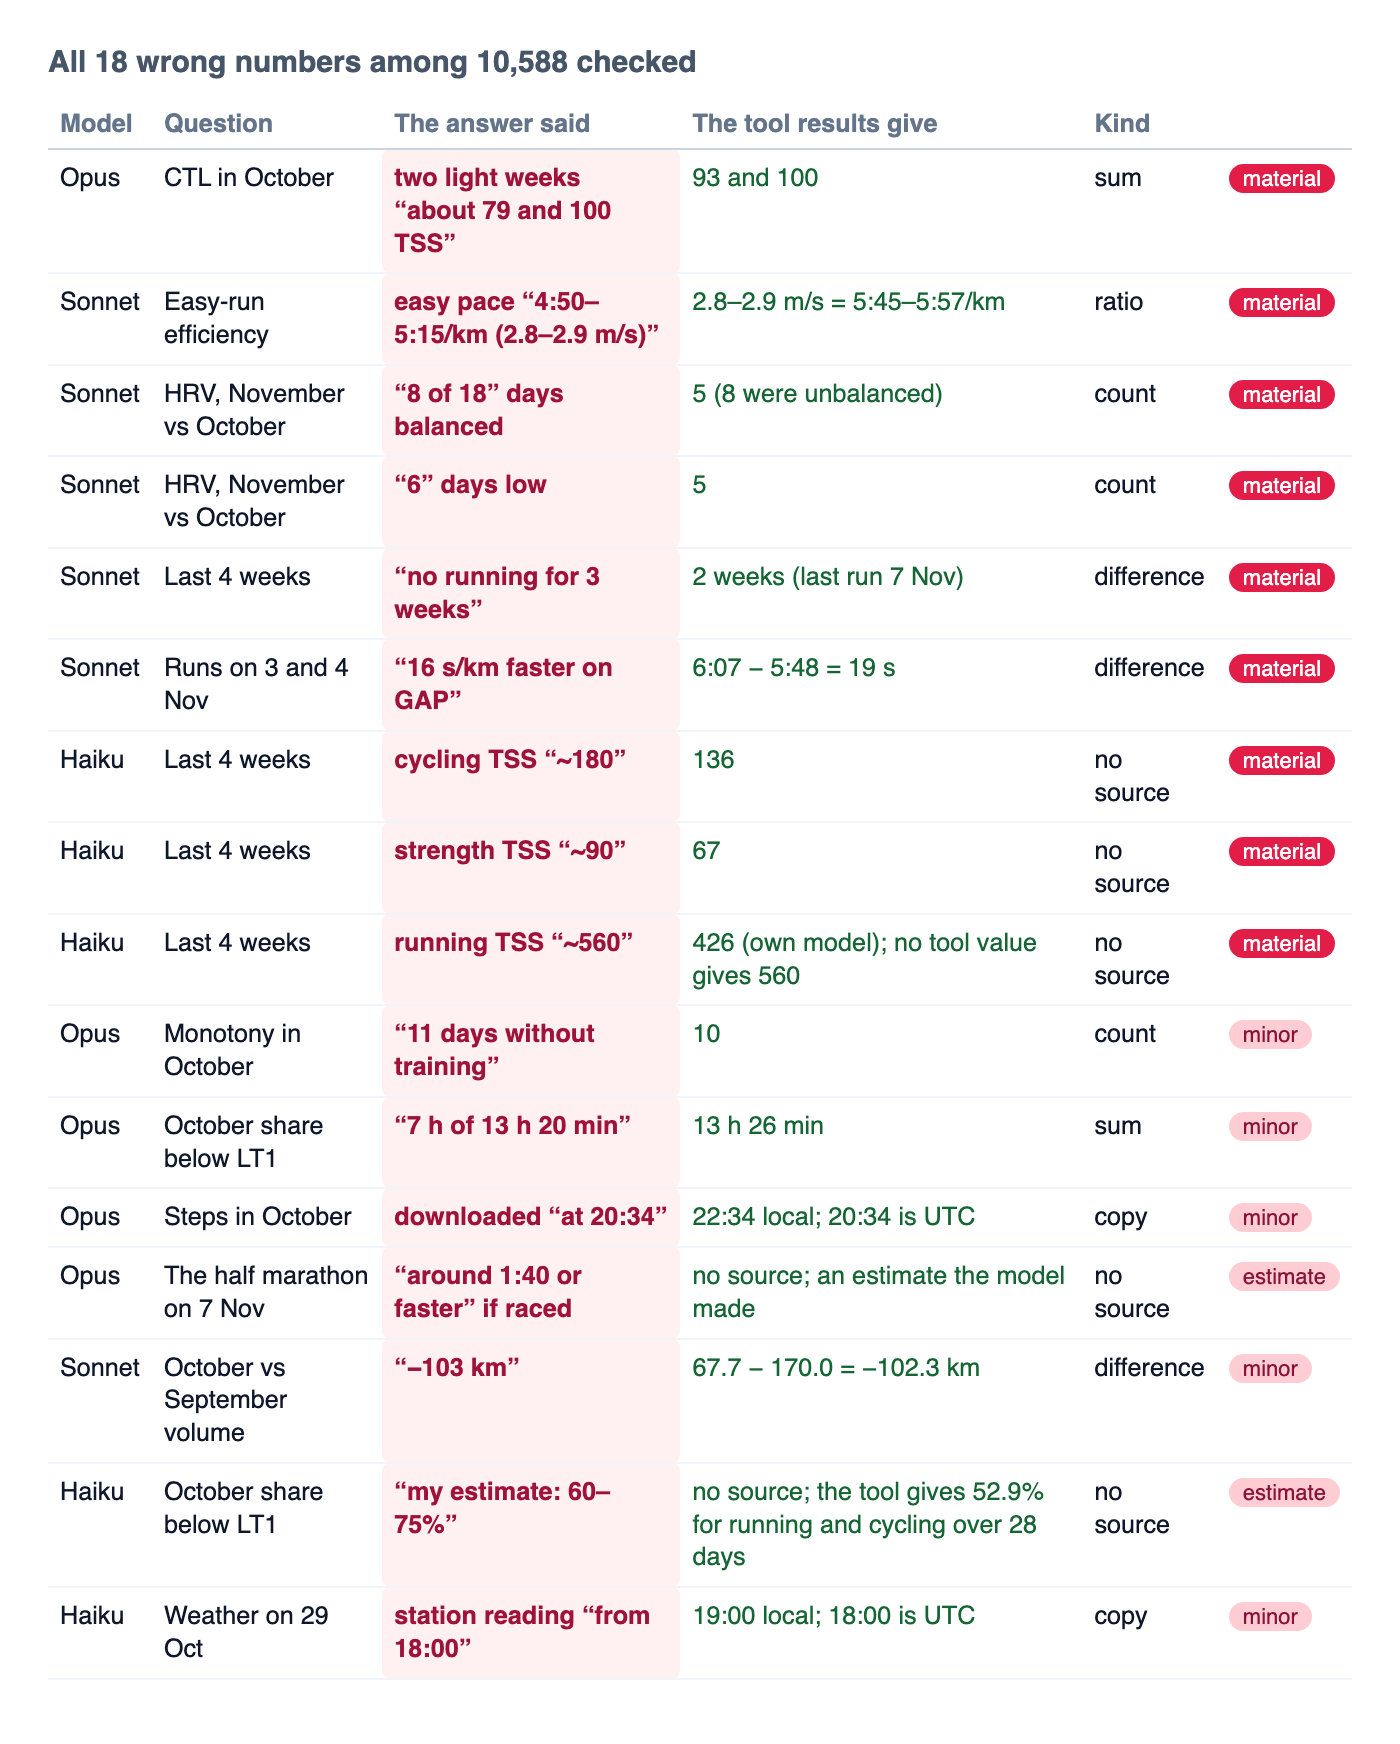
All eighteen, with what the tool results give. Two numbers of one statement share a row.
Five are slips I would never notice, like "−103 km" for −102.3 or "11 days without training" when there were 10. The ten material ones had a few distinct causes:
- A wrong conversion. Sonnet described my September easy runs as "4:50–5:15/km (roughly 2.8–2.9 m/s)". The speed is right; the pace that goes with it is 5:45–5:57/km. The two halves of one sentence disagree.
- A wrong count. In the HRV answer above, Sonnet said 8 of 18 November days were "balanced". The tool rows give 5 balanced and 8 unbalanced, so it counted the wrong label. And "6" low days were 5.
- A wrong period. "No running for 3 weeks": my last run was on 7 November, two weeks before I asked.
- Numbers without a source. In a four-week summary, Haiku gave training stress per sport of about 560, 180 and 90. My own load model in the tool result says 426, 136 and 67. Its weekly totals in the same answer were right.
In the earlier run, Haiku made the same kind of mistake on the same question, with a running TSS of "about 550".
The estimates are a different case. Asked how my half marathon went, Opus said I could run "around 1:40 or faster" if I raced for myself; Haiku estimated "60–75%" of my running below LT1 when the tool only gave a figure for running and cycling together. Both said these were their own estimates. They are not data, but they are honest about it.
No wrong number came from the readiness, sleep, threshold or training-status questions. (Readiness and HRV here are training information, not medical advice.)
Where the model does its own arithmetic
How much the model calculates depends on the question.
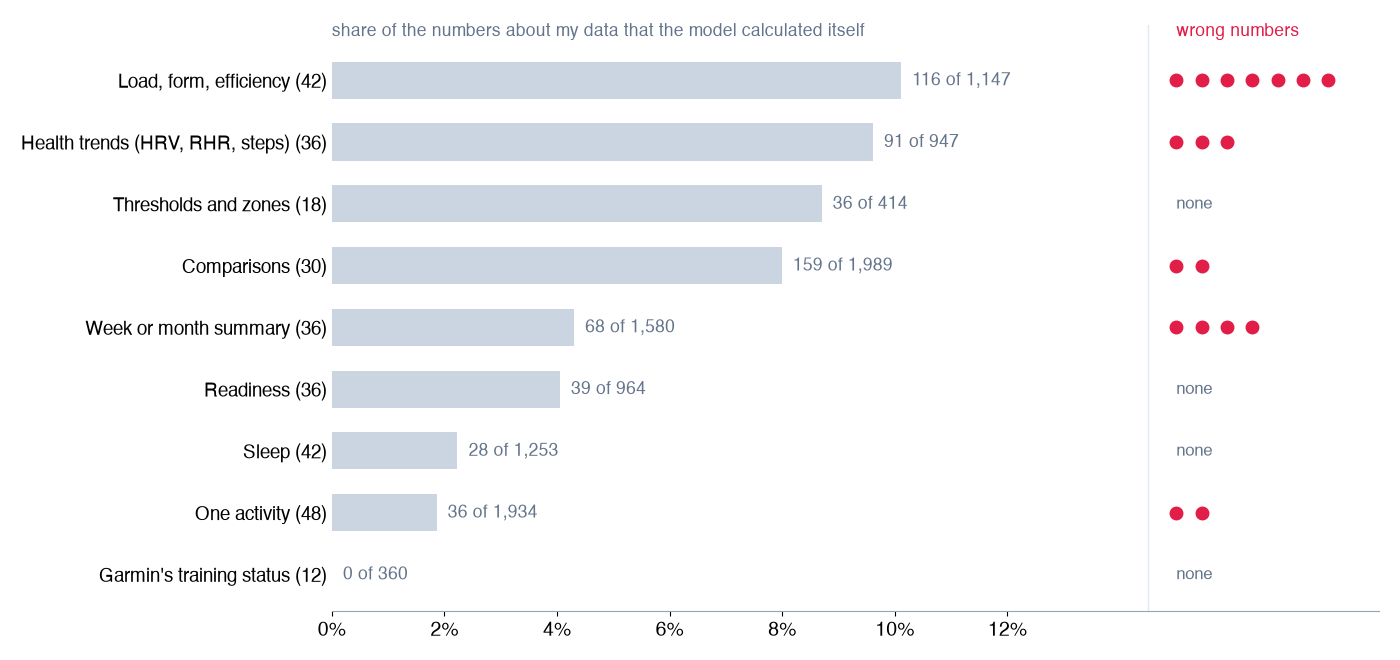
Share of numbers calculated by the model, by question type, with the number of answers in brackets.
For Garmin's training status, one activity or one night of sleep, the tool result already holds the answer and the model copies it: 2% of the numbers or less were calculated. Questions about load and efficiency, health trends and comparisons ask for differences, averages over periods the user picked, counts and paces, and around 10% of their numbers came from the model. That is also where most of the errors were.
Opus, Sonnet or Haiku?
All three were 99.8% faithful or better, and their error counts are close: 5 wrong numbers for Opus, 7 for Sonnet and 6 for Haiku. The calculation errors moved between models from run to run: Haiku had none this time and four in the earlier run, Sonnet seven this time and six before. With a handful of errors per model, I would not rank them on this.
They differ in how much they say. Opus wrote 41 numbers about my data per answer, Sonnet 35 and Haiku 30, and Opus calculated the most. And they differ in price: at list prices one answer cost about 9.5 cents with Opus, 3.9 with Sonnet and 0.3 with Haiku. The median answer took 12 seconds with Opus and about 8 with the others.
What this means for the server
The design conclusion is simple: when the model copies, it is almost always right, and when it calculates, it is right most of the time but not always. So every value that answers a common question should already be in the tool result, computed in code that is tested once, rather than left for the model to work out in every answer. In these 300 answers that meant counts of days by status, totals per sport and per week, differences between periods, and paces next to speeds. The same goes for time: a value stored in UTC next to local ones was the only thing the models copied wrong.
Which of these belong in the server, and in what form, is a design decision I have not made yet.
What this does not show
- One athlete, my questions. 50 questions about my own data, written by someone who knows the tools. Other people ask differently.
- Three models, one client. Opus, Sonnet and Haiku 5.5 in Claude Code, two answers per question each. Errors per model are counted in single digits.
- Numbers, not meaning. I checked that each number exists or follows from the tool results. A correct number attached to the wrong thing is only partly covered by the sample and the header check. One answer, for example, named the heart rate zones one step off while giving the right boundaries; that is not counted here.
- Some decisions are mine. The 10% line between minor and material, and whether a hedged estimate is an error, are my judgment. All 217 decisions are in a file with a reason each.
- A model in the checking loop. The second stage used Sonnet to propose sources. It never decided right or wrong, but it could miss a source that exists, which would make an answer look worse, not better.
If you are building an MCP server
- Test the answer, not just the tool call. Keep the tool results and trace every number in the reply back to them.
- Separate copied numbers from calculated ones. Here they differed by almost two orders of magnitude.
- Find the questions where the model calculates most, and consider computing those values in the server.
- Use one time zone per record, and say which.
- Let code give the verdict, and check table cells against their column headers. A model can help find where a number came from, but recompute the arithmetic yourself.
The server is at https://github.com/endurancetools/garmin-mcp, and the documentation is at https://endurancetools.github.io/garmin-mcp/. The questions, the extraction and checking scripts, every number's class and my review decisions sit beside this article, without the raw answers, which hold my data.
Unofficial; not affiliated with or endorsed by Garmin.
Some illustrations in this article were generated with ChatGPT.
 Follow @marcin_running on Instagram