My AI coach has two training load scores. They disagree on most of my sessions.
I scored 367 sessions of my 2026 season with both. They ranked the sessions almost alike, but one TSS point was worth 0.8 Garmin points on a hike and 3.3 in an interval run. In the weeks when fitness clearly moved, both curves said the same thing 15 times out of 16.
- Own training data
- AI-assisted, author-checked
 Two scales, the same training, different weights. (AI-generated illustration)
My watch gives every session a number it calls training load. My own software gives the same session a Training Stress Score (TSS). Both feed a fitness curve, both claim to say how hard I trained, and they almost never show the same number.
I wrote about CTL, ATL, TSB and ACWR on my own season earlier. This article asks a narrower question: if I run the same season through Garmin's load and through TSS, where do they agree, where do they part, and does it matter for the questions I actually ask?
I run, race triathlons and trail ultras, and I build Garmin MCP, an unofficial, open-source MCP server that lets an AI assistant answer questions from Garmin Connect data. It computes TSS on my machine and keeps Garmin's load next to it, so both are in one local database. Everything below comes from that database, plus 28 extra requests to Garmin for weekly snapshots of its own training status.
Two different questions
TSS asks how long you worked and how hard relative to your threshold. An hour at threshold is 100, and stress grows with the square of intensity. My server scores each session from the best source it has: power for rides, grade-adjusted pace for runs, heart rate for everything else (hikes, strength, and my swims, because I never recorded a critical swim speed).
Garmin's training load is based on EPOC, the extra oxygen your body uses after exercise, estimated from heart rate. Garmin does not publish the formula, so I treat it as a black box and only look at what comes out.
These are not on the same scale and are not meant to match. Across the sessions of my season, from 1 January to 18 November, I collected 15,018 TSS and 30,744 Garmin load points: 2.05 Garmin points per TSS point on average. The interesting part is everything that does not follow that average.
Session by session: same order, different weights
I compared 367 sessions. A triathlon counts as one session with its legs added up; I left out one run that was stored twice and two walks without a Garmin load.
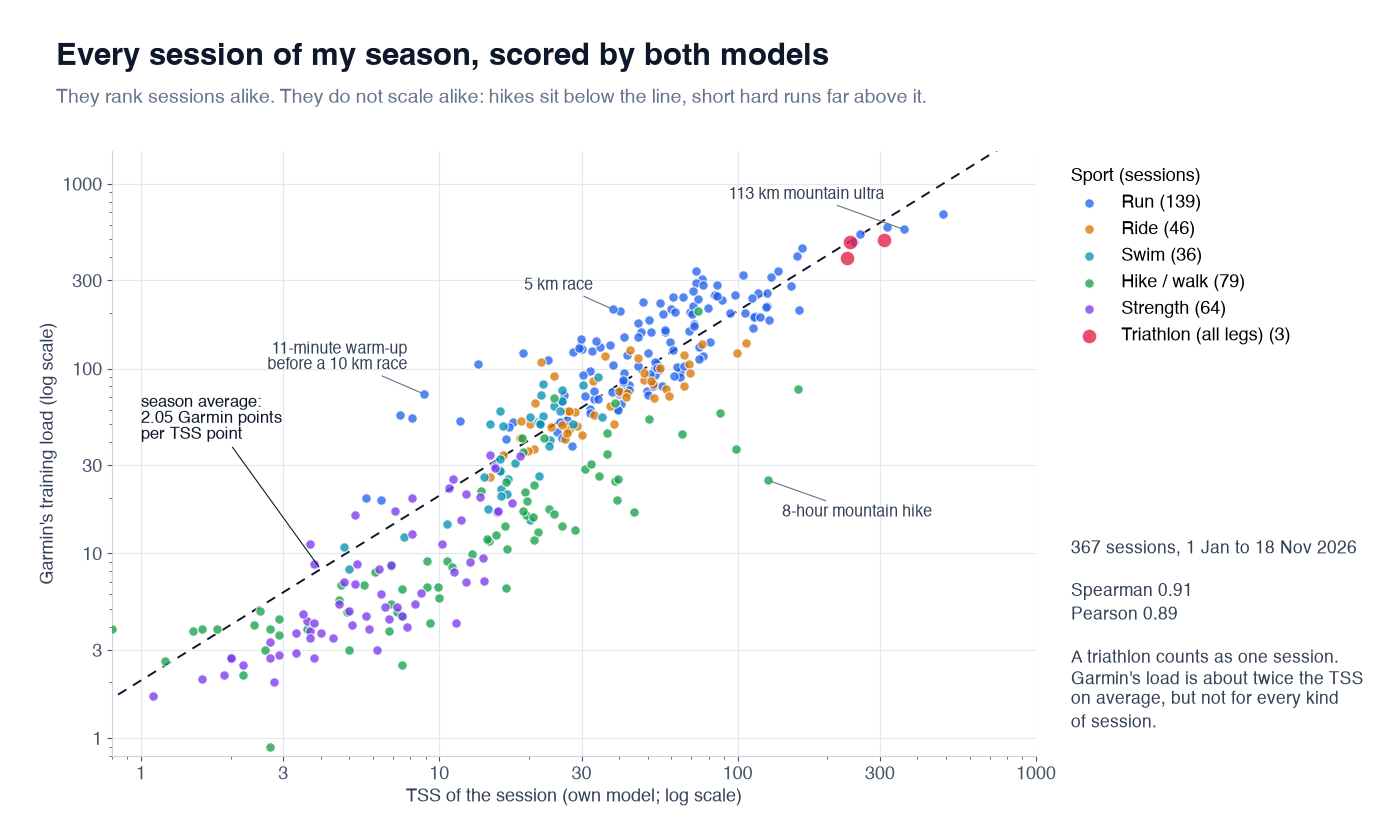 Every session of 2026, both axes on a log scale. The dashed line is the season average.
The two models rank sessions very much alike: a Spearman correlation of 0.91 (Pearson 0.89). Within single sports it is lower, between 0.76 for rides and 0.90 for hikes.
The ratio between them is where the stories are. Here is how many Garmin points one TSS point was worth, by kind of session:
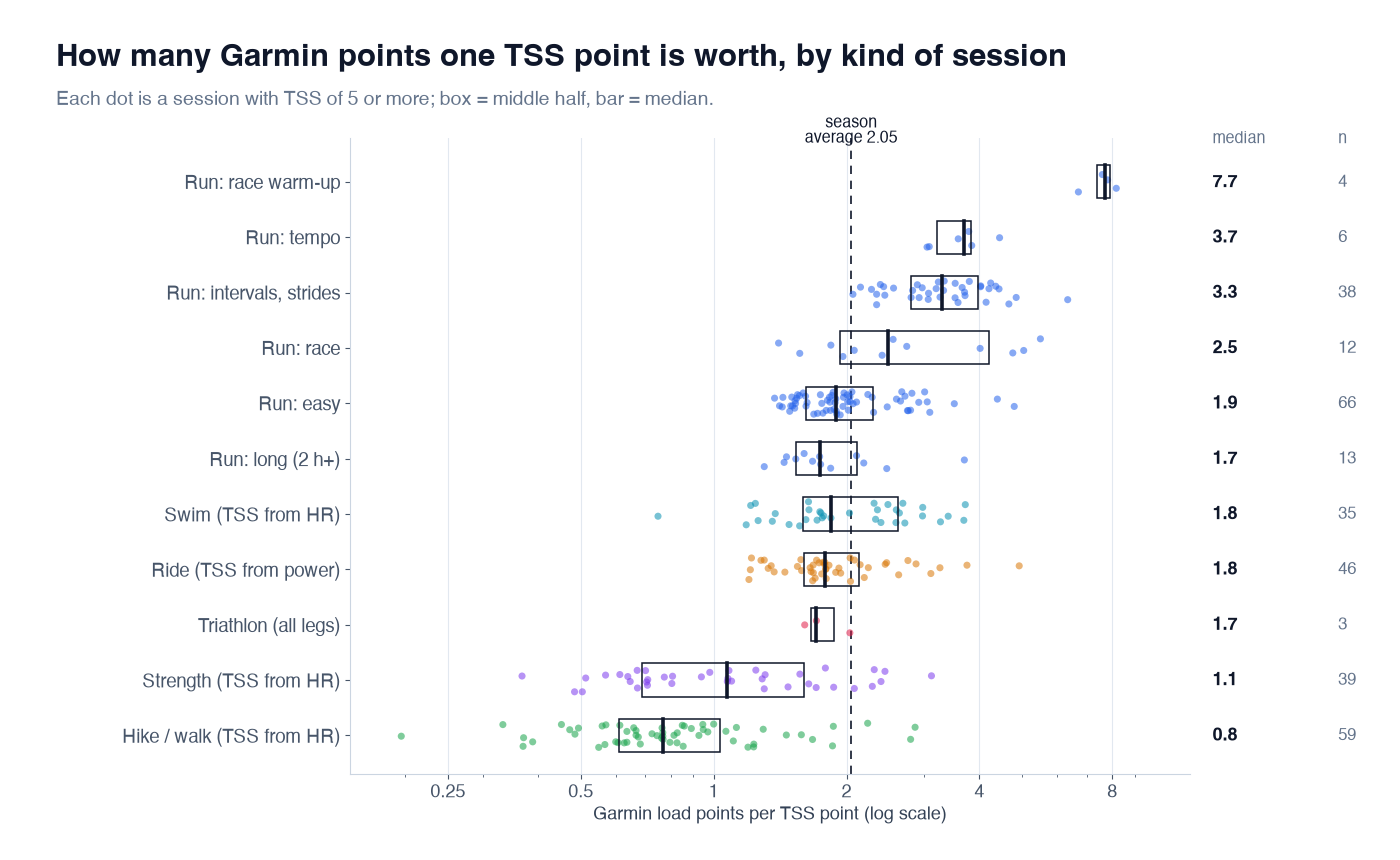 Medians per group, sessions with a TSS of at least 5. My groups: races from my race list, intervals from the workout name or Garmin's anaerobic effect, long means two hours or more.
- Hikes and walks: 0.8. Under half the season average. Hiking was 11% of my season's TSS and 5% of its Garmin load.
- Strength: 1.1. About half the average.
- Easy runs 1.9, long runs 1.7, rides and swims 1.8. Close to the average.
- Intervals and strides 3.3, tempo runs 3.7. 1.6 to 1.8 times the average.
- Race warm-ups: 7.7. Eight to fourteen minutes of running before a short race, scored by Garmin like a proper workout.
Running made up 63% of my TSS and 73% of my Garmin load, because the hard sessions were runs.
What drives the gap
Two things explain most of it, and I could measure both.
Duration. TSS grows in proportion to time: twice as long at the same intensity is twice the TSS. Garmin's load does not. I fitted Garmin's load against duration and intensity factor on a log scale. For runs scored from pace, doubling the duration at the same intensity raised Garmin's load by about 68%, not 100% (an elasticity of 0.75, 95% interval 0.67 to 0.84). For rides it was 0.62, for hikes 0.68. Long, steady sessions earn fewer Garmin points per hour.
Short, hard bursts. My running TSS uses Garmin's average grade-adjusted pace for the whole run. Ten 100 m strides inside an easy run barely change the average pace, so the TSS barely moves. Garmin's load, built from heart rate and a model of how far the session pushed you, sees them. That is why interval days and warm-ups with strides sit so high. The intensity elasticity for runs came out at 2.35 (1.85 to 2.85), not far from TSS's 2: steady hard running is scored much alike. Bursts are not.
The picture fits a load that follows how high the effort climbed more than how long it lasted. That is my reading, not Garmin's documentation.
The sessions where they disagree most
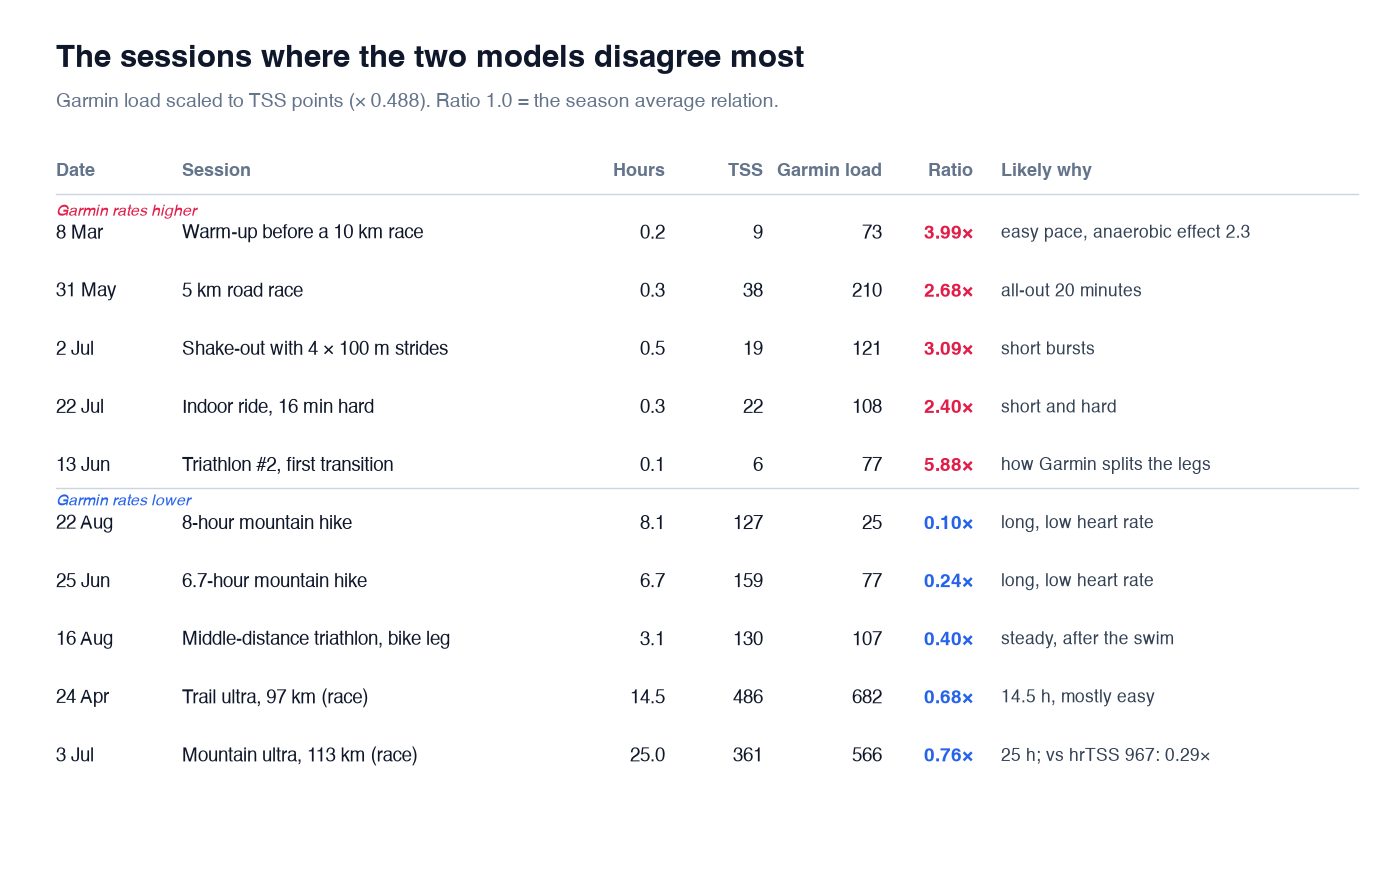 Garmin's load scaled to TSS points (× 0.488, the season ratio). 1.0 means the two agree as well as they do on average.
The extremes fall into four groups.
- Mountain hikes. My 8-hour hike in August scored 127 TSS and 25 Garmin points; scaled, Garmin rates it at a tenth of the TSS. Heart rate sat low for hours. TSS counts every hour of it; Garmin's load hardly moved.
- Ultras. The 113 km mountain race took 25 hours. From pace it scored 361 TSS, from heart rate 967, and Garmin gave it 566 points, 276 in TSS units. The pace score already reads low for power-hiking steep climbs, and Garmin reads lower still. Against the heart-rate TSS, it is less than a third. The 97 km race looks the same, at 0.68.
- Short and sharp. A 5 km race, a 16-minute hard indoor ride, an easy run with four strides the day before an ultra. Two to four times the average relation.
- Triathlon legs. Garmin stores one load for the whole race and a running total at the end of each leg. My server gives each leg its increase over the leg before, so the legs add up to Garmin's total. In two of my three triathlons, the first transition, five to eight minutes from the water to the bike, got 77 and 81 Garmin points; in one of them that was more than the whole swim before it. In the middle-distance race, the 3-hour bike leg got less Garmin load than the 44-minute swim. The race total is fine. The split between legs is not something to read physiology into.
Bland–Altman: same total, wide spread
A correlation says the two rise together. It does not say how far apart they can be for one session. For that I scaled Garmin's load to TSS points with the season ratio and drew a Bland–Altman plot on a log scale, so the differences read as ratios.
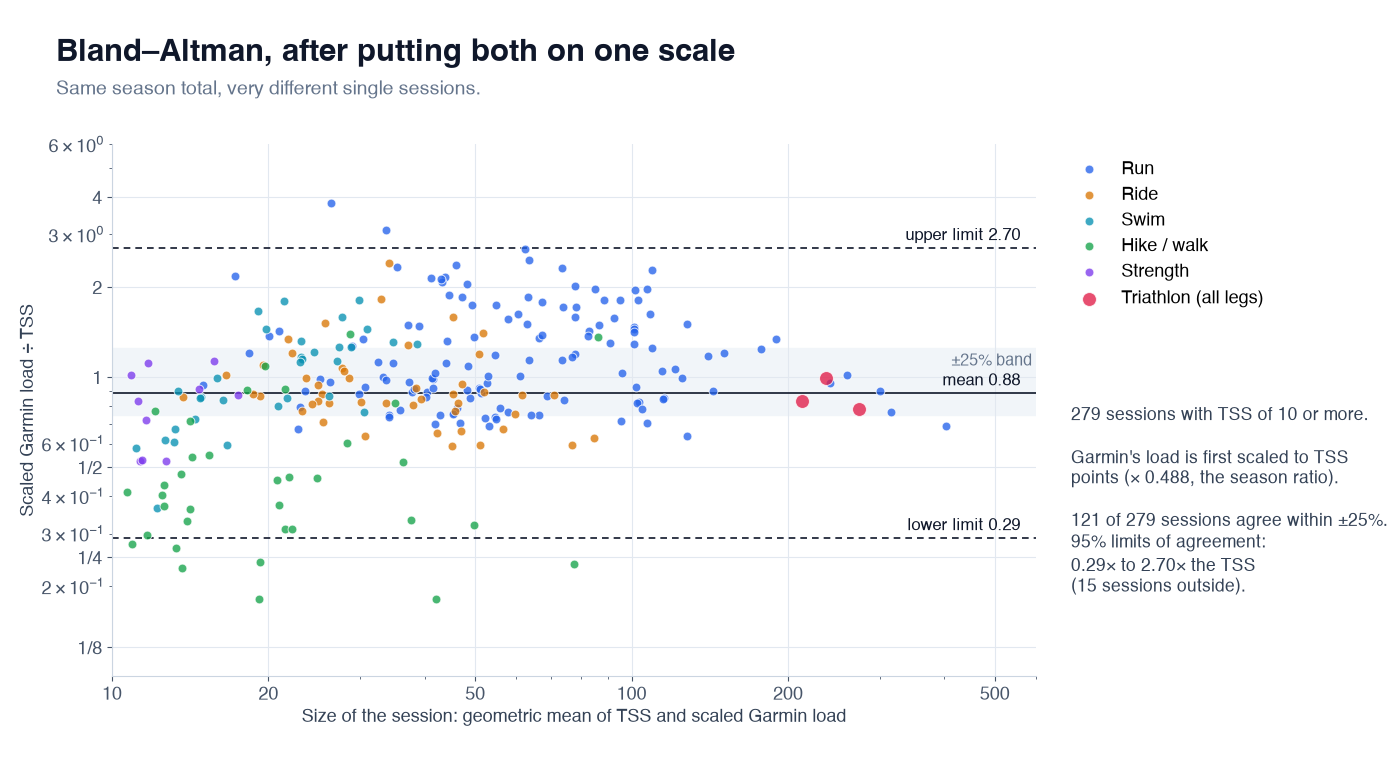 Sessions with a TSS of at least 10. The shaded band is ±25%.
Of 279 sessions with a TSS of 10 or more, 121 (43%) agreed within ±25% after scaling. The 95% limits of agreement were 0.29× and 2.70×: for a single session, Garmin's load can tell you almost anything from a third to almost three times what TSS says. The two are not interchangeable at the level of one workout.
Season curves: one shape, two summits
The surprise came when I put both through the same 42-day fitness average.
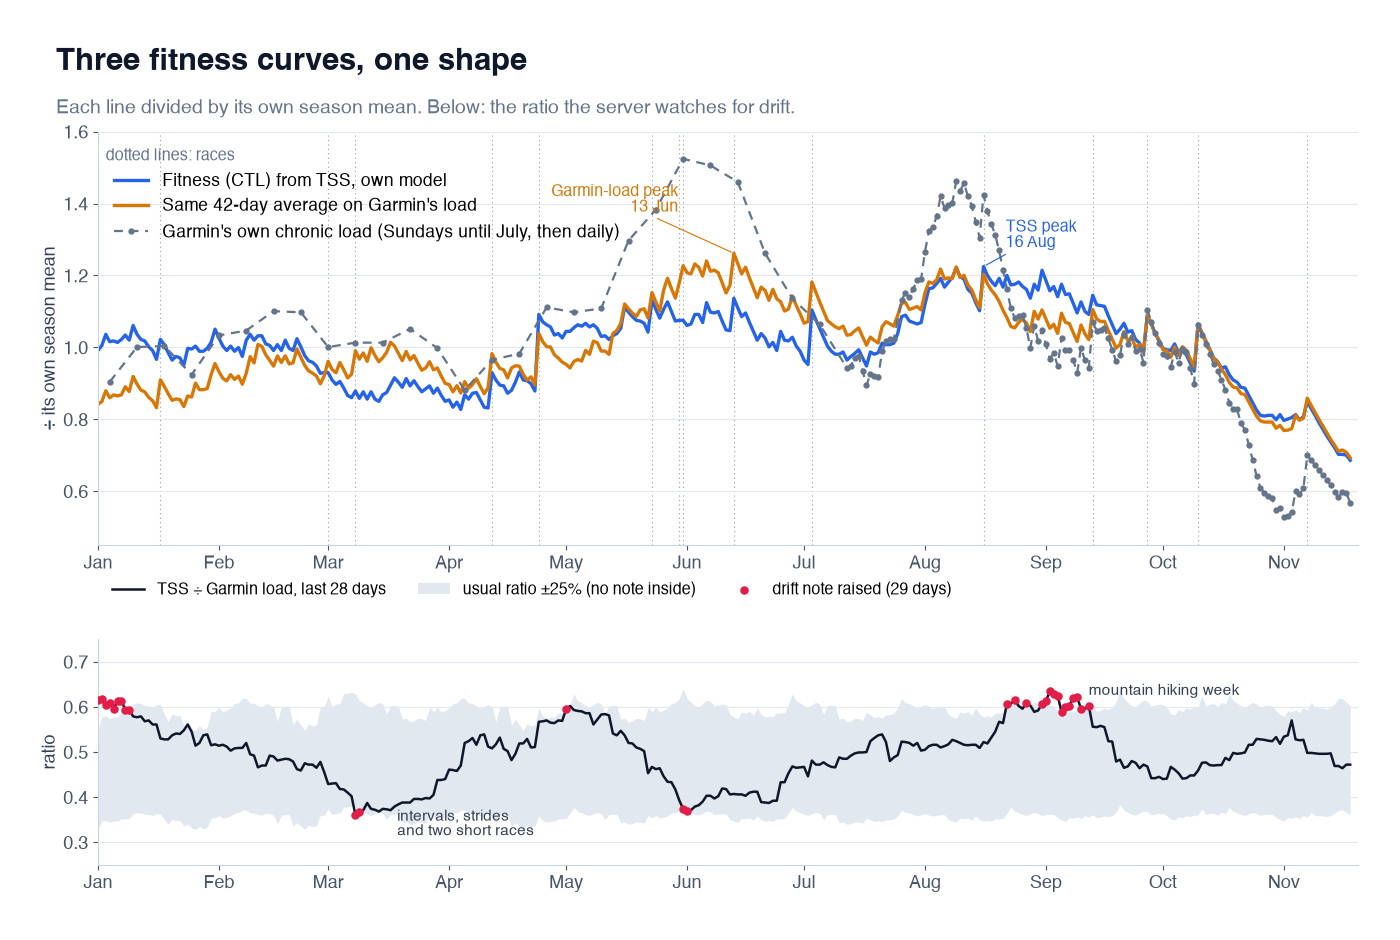 Top: fitness from TSS (blue), the same 42-day average on Garmin's load (orange) and Garmin's own chronic load (grey). Bottom: the 28-day ratio my server checks for drift.
The curves share a shape: up through spring, a plateau from May to September, down after the last race. Daily values correlate at 0.79.
They disagree about the summit. From TSS, my fitness peaked on 16 August, the day of a middle-distance triathlon, after weeks of long rides and swims. From Garmin's load it peaked on 13 June, in a block of 5 km races, a second triathlon and interval sessions. The difference is small: each curve stood at 93 to 95% of its own peak on the other's peak day. But if I had asked "when was I fittest this year?", the two would have given different months, for the reasons above: long steady work counts more in TSS, short hard work more in Garmin's load.
Garmin's own chronic load, which I only have for Sundays until July and daily after that, followed the curve built from Garmin's per-activity load closely (r = 0.94) and my TSS curve a little less (0.85). Its acute load moved almost exactly with a 7-day average of the same per-activity loads (r = 0.97).
Week to week: same direction when it matters
Most of my questions about load are about direction: did fitness go up this week, am I fresher than last week? So I compared the change in each fitness curve from Sunday to Sunday over 45 weeks.
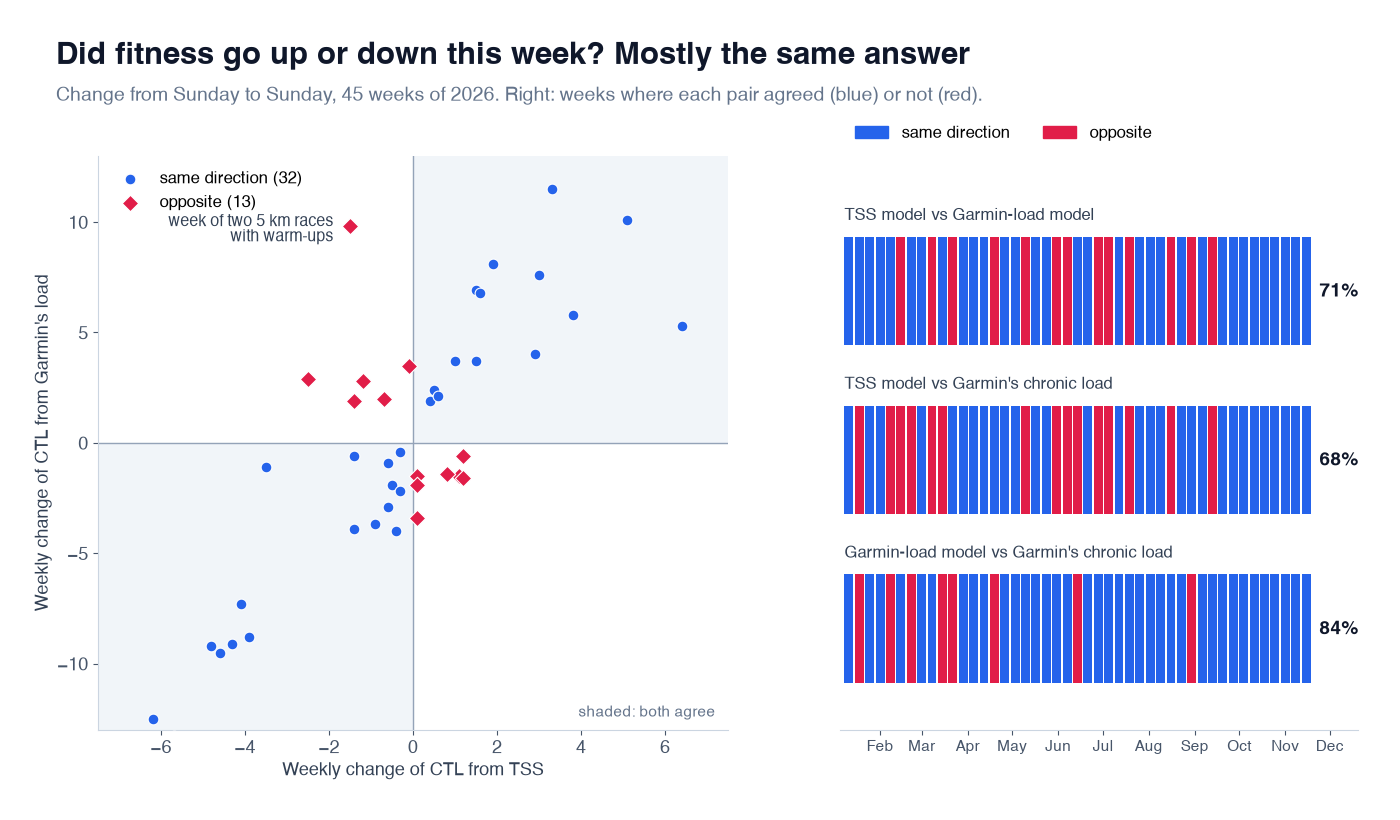 Each dot is one week. Right: weeks where each pair moved the same way (blue) or not (red).
They moved the same way in 32 of 45 weeks (71%), and the weekly changes correlated at 0.73 (Spearman). That sounds mediocre until you look at which weeks disagree. In the 16 weeks where my TSS fitness moved by 2 points or more, the two agreed 15 times. In the 29 quieter weeks they agreed 17 times, close to a coin toss, because a change of a few tenths can tip either way.
The clearest opposite week was the one with two 5 km races and their warm-ups at the end of May: by TSS a light week, fitness down 1.5; by Garmin's load a big one, up 9.8.
Form agreed in the same way. I put both into the same bands relative to fitness (fresh, neutral, training, overreaching). On 196 of 322 days (61%) they gave the same band, and on only 7 days (2%) one said fresh while the other said I was in a training or overreaching state. Five of those were in March after the 5 km and 10 km races, the other two in the August hiking week.
On all 15 race mornings, neither model called me tired while the other called me fresh. The TSS model said fresh on 11, the Garmin-load model on 8, and both said neutral or fresh on every one but the second 5 km race. Garmin's own status the day before the 26 km trail race and the marathon was "Strained", but that status also weighs heart rate variability, so it is not a load verdict. These are training numbers, not medical advice.
What this means for the drift note
My server compares the two all the time. In every answer from its own load model it reports the ratio of TSS to Garmin's load over the last 28 days and its usual value, and when the current ratio is more than 25% away, it adds a note.
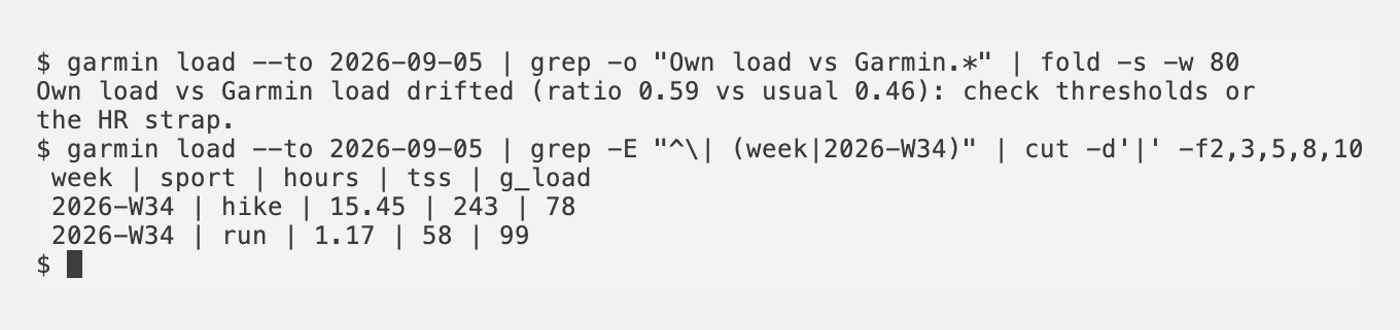
garmin is the command-line companion, npx -y garmin-mcp-cli. The note and the week behind it.
Over this season the note appeared on 29 of 322 days. I replayed the server's rule day by day and looked at what was behind each stretch. The note suggests checking thresholds or the heart-rate strap; what I found was mostly a change in the kind of training. The longest stretch, 15 of the 29 days from late August into September, followed a week with over 15 hours of mountain hiking (the ratio rose to 0.64 against a usual 0.48). The lowest ratio, 0.36 against 0.50 in early March, followed a block of intervals, strides and two short races, and the next low came on the weekend of the two 5 km races in May. The first nine days of January I cannot pin on one cause. The ratio is a fair alarm, but on my data the first thing to check is the training mix, not the strap.
What I take from it
- Use either for direction, neither for a single session. For "is my fitness rising?", both answered the same in 15 of 16 weeks where fitness clearly moved. For "how hard was yesterday?", they can differ by a factor of three.
- Know what each one undercounts. TSS from average pace misses strides and bursts; Garmin's load misses long, low-intensity hours. In a season with mountain hiking or ultras, Garmin's load reads the summer lighter. In a block of short races and intervals, TSS reads it lighter.
- When they drift apart, look at what you did. A hiking week or an interval block moves the ratio as much as a wrong threshold would.
In practice I ask for both at once: "show my fitness since July from my own load and from Garmin's" becomes get_load twice, once with source: "garmin_load", and get_training_status adds Garmin's own acute and chronic load.
Limits
- One athlete, one season, my labels. 367 sessions from me. Races come from my own list, because none of my activities is marked as a race in Garmin, and the interval label uses Garmin's anaerobic effect, which comes from the same heart-rate engine as its load.
- My TSS has its own biases. Running uses average grade-adjusted pace, not a second-by-second normalized pace, and swims, hikes and strength are scored from heart rate. Some of the gap is my model, not Garmin's.
- Garmin's own status is sparse before July. I fetched one snapshot per Sunday from January to mid-July; daily values exist only from 13 July.
- One run was stored twice. On 18 February the same run appears twice in my database, with the same start time, and both models count it twice. I left the copy out of the per-session comparison but not out of the fitness curves.
Code: https://github.com/endurancetools/garmin-mcp Documentation, including Training analytics and Methods and evidence: https://endurancetools.github.io/garmin-mcp/
Unofficial; not affiliated with or endorsed by Garmin.
Some illustrations in this article were generated with ChatGPT.
 Follow @marcin_running on Instagram