Heart rate lags on intervals. Over a season, my AI coach's training load barely noticed.
I scored 186 runs and rides of my 2026 season from heart rate and from pace or power. Inside a 20-second stride, heart rate gave half the stress that pace did. Over whole interval sessions it came out about where it does on my easy runs. The big gaps were mountain races and easy rides, and the heat did not show up at all.
- Own training data
- AI-assisted, author-checked
 Pace changes at once; heart rate follows late and rounds the corners. (AI-generated illustration)
Every training-stress model has a fallback. When there is no power meter and no usable pace, it scores the session from heart rate: hrTSS. The documentation of my own software says what is wrong with that fallback, in one sentence I wrote myself: heart rate lags behind short efforts and drifts up in the heat, so hrTSS reads low for intervals and strength work and high on hot days. That is why it comes after power and pace.
It is a standard claim. I had never checked it on my own data. So I did.
I run, race triathlons and trail ultras, and I build Garmin MCP, an unofficial, open-source MCP server that lets an AI assistant answer questions from Garmin Connect data. It keeps every activity in a local database and scores each one from the best source it has: power for rides, grade-adjusted pace for runs, heart rate for the rest. It also computes hrTSS for every session with heart rate, whatever source wins. That gives me two scores for the same session, and the question almost asks itself.
I wrote about how the load model works on my own season earlier, and about how Garmin's training load compares with TSS. This one stays inside my own model and asks a narrower question.
Two scores for the same session
Between 1 January and 18 November 2026 I had 139 runs scored from pace and 47 rides scored from power that also had heart rate. For each one I took the default score (rTSS from Garmin's average grade-adjusted pace, or TSS from normalized power and FTP) and hrTSS, computed from the time in Garmin's heart-rate zones, and divided one by the other. Below 1, heart rate scores the session lower.
Across all runs the median was 1.02. Across rides it was 1.21. So far, nothing undercounts. The interesting part is how it splits by kind of session.
I sorted the runs by a simple rule. If the workout name had repetitions in it, the run became easy + strides (100 m), short reps (45 seconds to 400 m) or long reps (800 m to 4 km). Otherwise: trail runs, races from my own race list, long road runs of 100 minutes or more, tempo (intensity factor 0.85 or more) and easy runs. Rides split into indoor and outdoor, easy and hard.
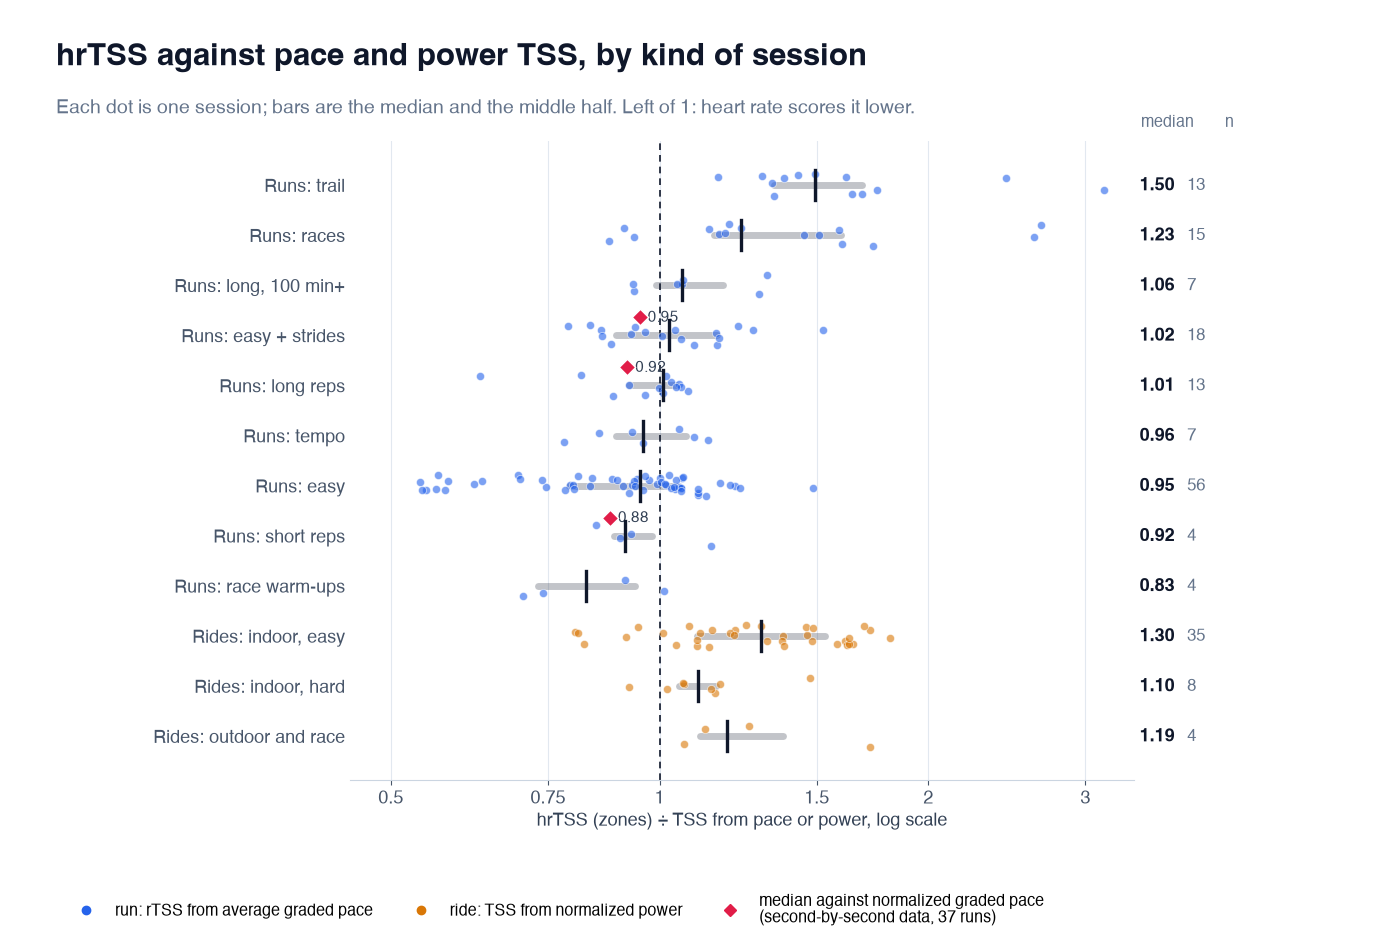 Each dot is a session. Blue: runs against rTSS from average pace. Orange: rides against TSS from normalized power. Red diamonds: the interval kinds against pace normalized from second-by-second data.
Against the default rTSS, interval runs did not score low at all. Long reps came out at 1.01, runs with strides at 1.02, against 0.95 for easy runs. The opposite of the claim.
That comparison is not fair to heart rate, though. My rTSS uses Garmin's average grade-adjusted pace for the whole run, not a pace weighted second by second. An average flattens intervals: ten fast minutes and ten slow ones average to a moderate pace, and rTSS from that average misses part of the work. The documentation says so too. So before blaming or acquitting heart rate, I had to fix the other side.
Fixing the pace side
For 46 runs (every run with repetitions, the three short road races and six easy runs for comparison) I downloaded Garmin's second-by-second activity details: grade-adjusted pace and heart rate, about one sample every two or three seconds. That took 46 requests, plus 26 more for weather that I will come to later.
From the streams I computed a normalized graded pace the way normalized power is computed: a 30-second rolling average, raised to the fourth power, averaged, and back. On steady easy runs it changed nothing (0.1%). On interval sessions it raised rTSS by a median of 7.5%, with a middle half of 5.7 to 11.1%.
With that, the interval kinds moved below 1: runs with strides to 0.95, long reps to 0.92, short reps to 0.88. Heart rate does score interval sessions lower than properly measured pace, by 5 to 12%.
But my easy runs sit at 0.95 too. Thresholds explain part of that: hrTSS and rTSS each depend on their own threshold, and those come from Garmin's automatic detection, which moved my threshold heart rate from 161 to 175 bpm in January alone. So I compared each run with the easy runs of the four weeks before and after it. Relative to that baseline, the interval sessions came out at a median of 0.99 (middle half 0.93 to 1.12). A 1% gap is noise.
Where the lag goes
So does heart rate lag at all? Yes, plainly.
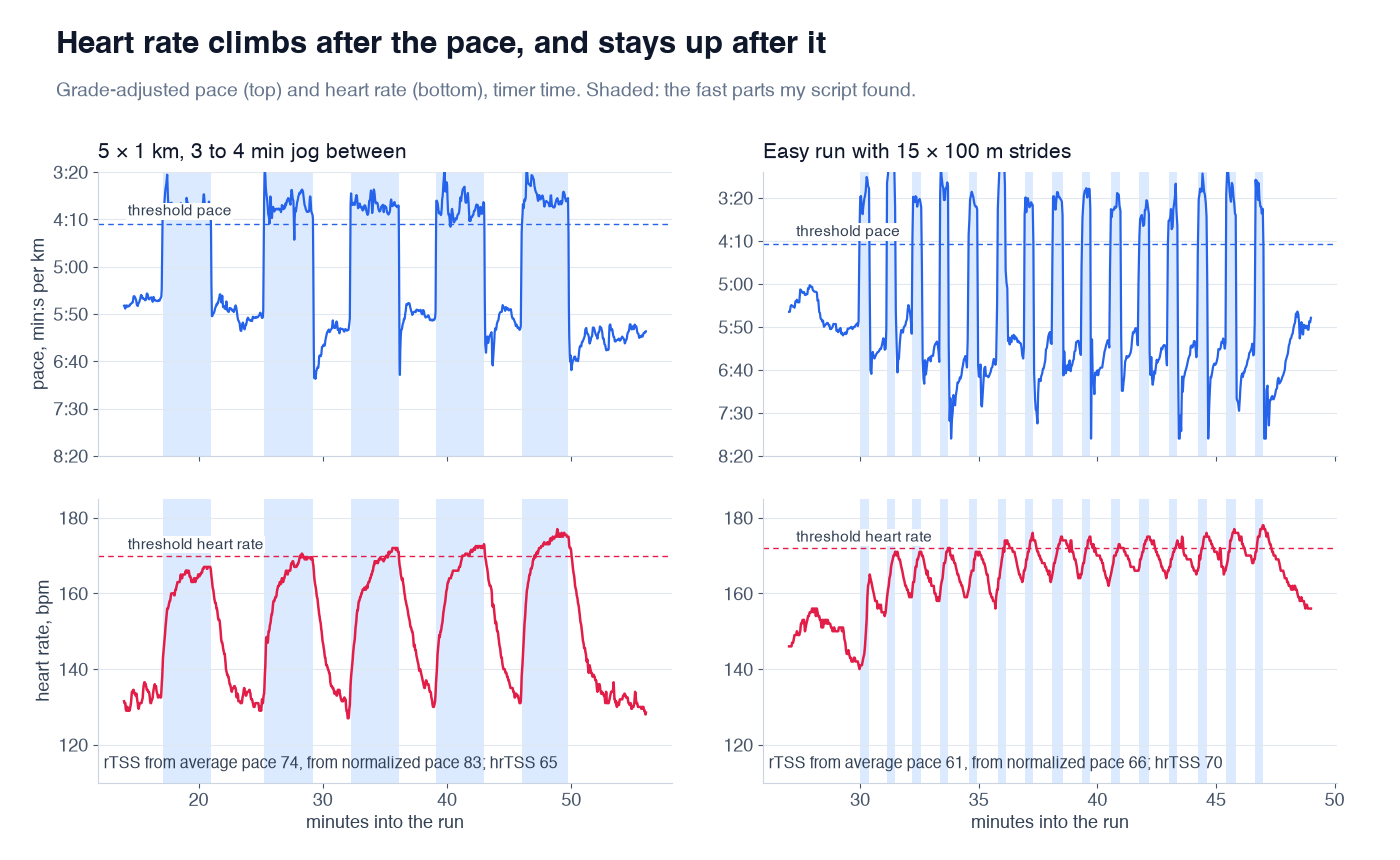 Two of my sessions. Shaded: the fast parts my script found. The 5 × 1 km is the clearest undercount of the season (hrTSS 65 against 83 from normalized pace).
Shifting heart rate against pace to find where they line up best, the lag across 37 interval sessions was 16 seconds (middle half 13 to 31). Then I cut every session into its fast parts and the rest, and compared the stress per minute that each source gives:
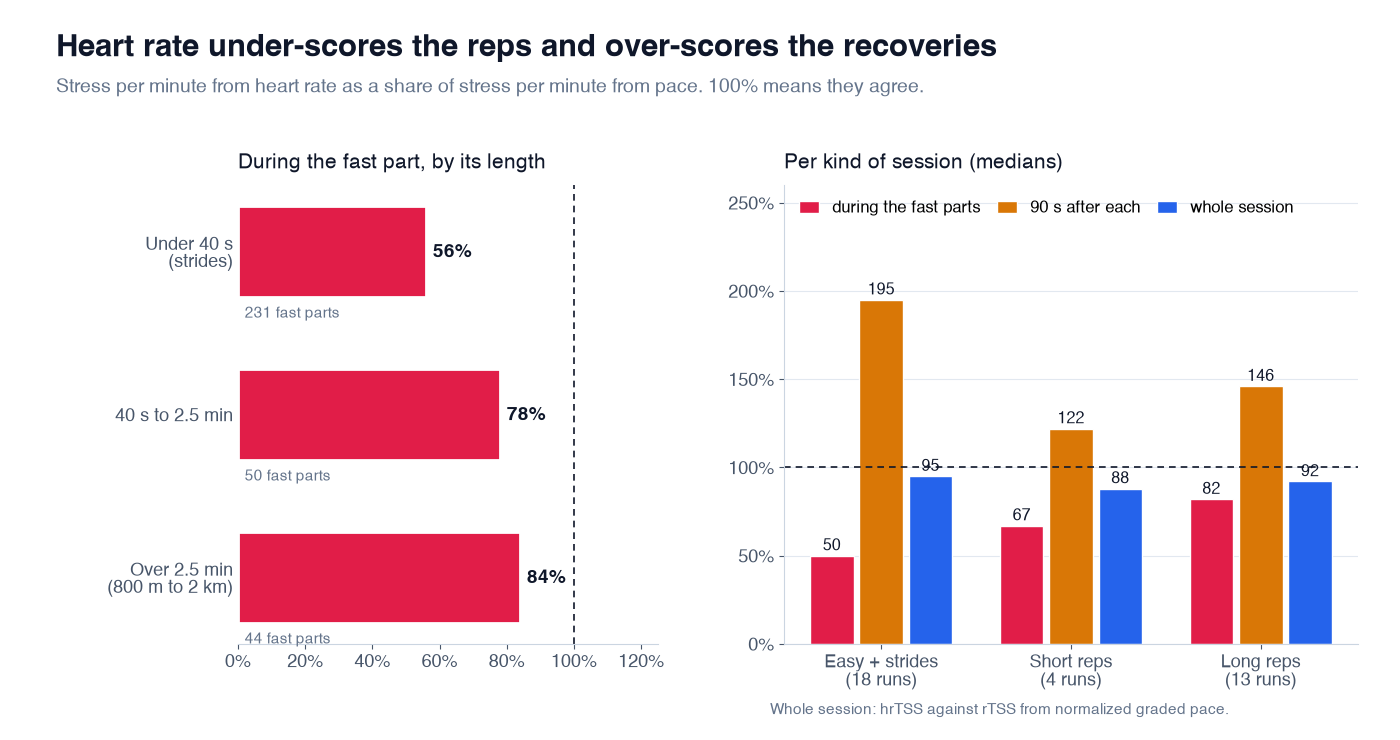 Stress per minute from heart rate as a share of stress per minute from pace. Medians over 325 fast parts in 38 runs.
- During a stride (median 23 seconds), heart rate gave 56% of the stress that pace did. During 40-second to 2.5-minute efforts, 78%. During 800 m to 2 km reps, 84%, because heart rate has time to catch up.
- In the 90 seconds after each fast part, the picture flips. Heart rate is still high while I jog, so it gave 195% of the pace stress after strides, 122% after short reps and 146% after long reps.
The lag is real, and on a 20-second stride it is large. But heart rate pays most of it back during the recovery. Over a whole session the two almost cancel out. The worst case of my season was the 5 × 1 km above: the reps are long enough to feel threshold-hard, the 3 to 4 minute jogs long enough for heart rate to fall back. Even there, the gap was 21%.
Heat: nothing to see
The second half of the claim says heart rate drifts up in the heat, so hrTSS reads high on hot days. I had two ways to test it.
For 26 continuous road runs spread over the season I downloaded the weather Garmin stores for each activity: air temperature at the start, from −4 to 36 °C. For 33 indoor rides from January to July, my bike computer had recorded the room temperature, 22.5 to 35 °C.
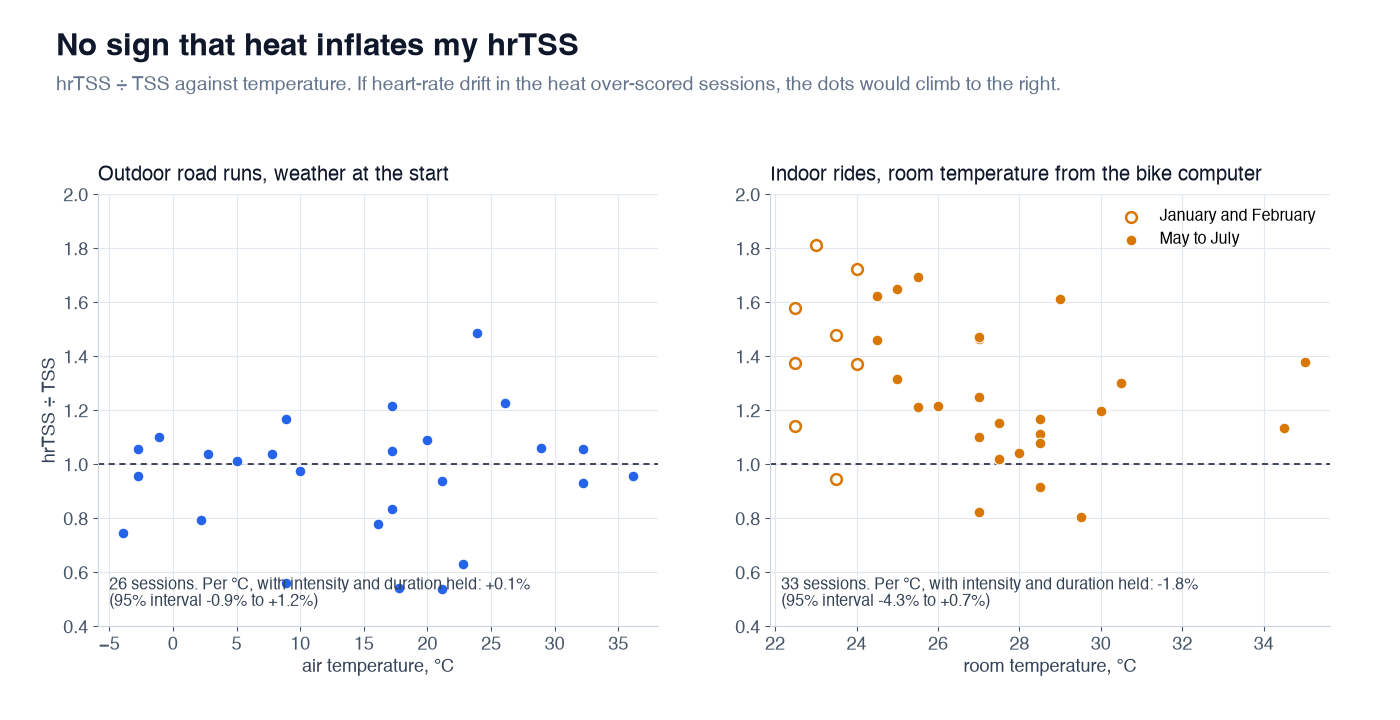 If heat inflated hrTSS, the dots would climb to the right. They do not.
For runs, with intensity and duration held constant, hrTSS rose by 0.1% per degree, with a 95% interval of −0.9 to +1.2%. Adding the thresholds of the day to the model changed nothing. For indoor rides, the ratio fell by 1.8% per degree (−4.3 to +0.7%), in the wrong direction. The cool rides were in January and February, and my power scores use one FTP, recorded in October, for the whole season. If my winter FTP was lower than that, winter power scores read low and the ratio high, which would explain the slope better than room temperature does.
So in my data the heat effect is too small to see. That does not mean cardiac drift does not exist; it shows up inside a long session as aerobic decoupling. It means that for whole-session hrTSS it was buried under everything else.
Where hrTSS really differs
The large gaps were elsewhere.
- Mountains. Trail runs scored 1.50, mountain races up to 2.7. Grade-adjusted pace was built for running hills, not for power-hiking steep climbs for hours. Heart rate counts that work; my pace model does not.
- Easy rides. Indoor easy rides scored 1.30. The easier the ride, the higher the ratio (Spearman −0.46): rides below an intensity factor of 0.55 had a median of 1.48, rides at 0.70 or more 1.13. On a bike, heart rate stays well above resting at loads where power stays low.
- Strength and hiking. No power, no pace, so no fair test. What I can see: in a typical strength session only 36% of the time was inside Garmin's heart-rate zones at all, and an hour of strength scored a median of 10 hrTSS, an hour of hiking 12, an hour of running 58. Whether that is low is a question heart rate cannot answer about itself.
The documentation also says that scoring by time in zones rather than by average heart rate takes back part of the interval gap. Across the whole season, zones gave 17,844 and averages 17,925. For runs the median ratio of the two was 1.01, for interval runs 1.01 to 1.03. Where they differ is easy, low-heart-rate sessions: time below zone 1 scores nothing in the zone method, so the quarter of my runs and rides with the lowest heart rate scored a median of 6% less from zones.
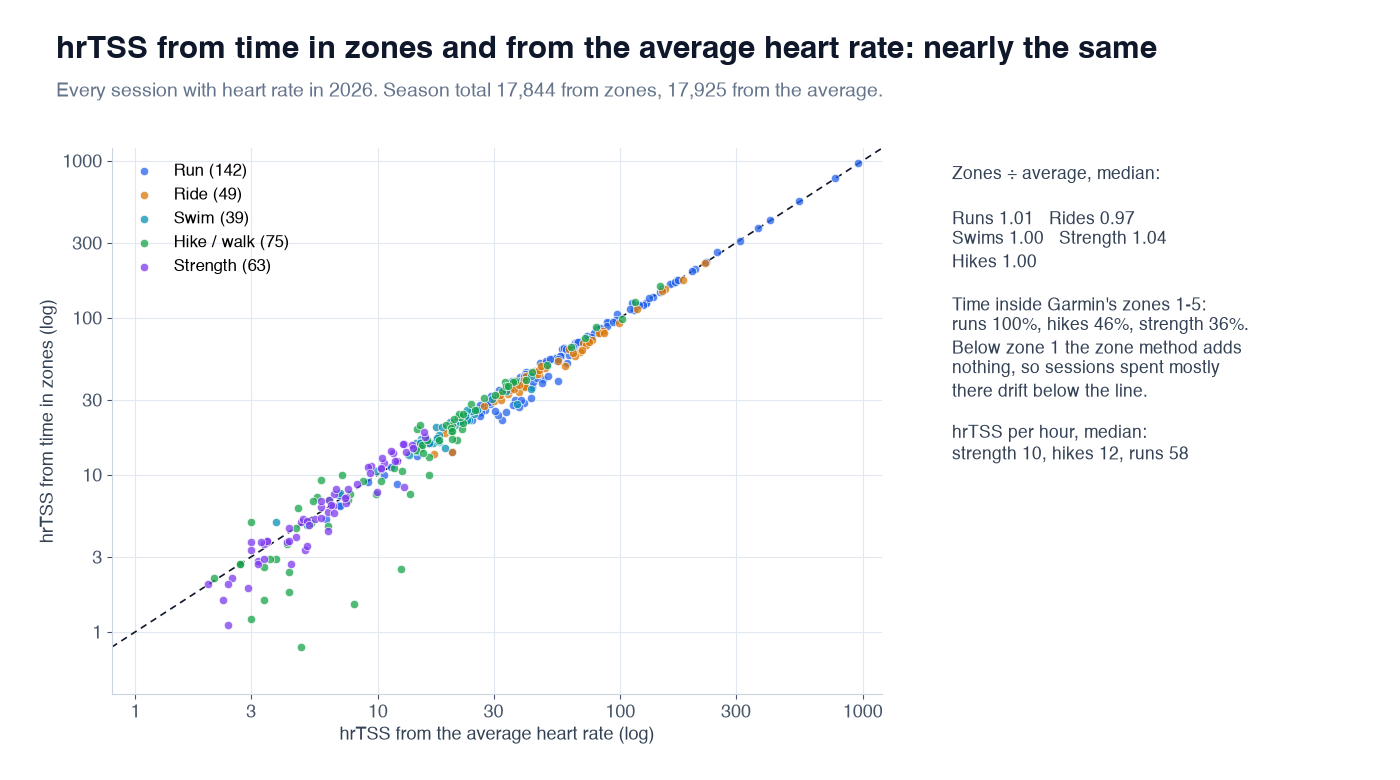 The zone method and the average method agree almost everywhere. Sessions spent mostly below zone 1 fall below the line.
What it does to the fitness curve
My server can sum hrTSS alone instead of the default (source: "hrtss" in get_load). Over the season that is 17,882 points instead of 15,071, 19% more.
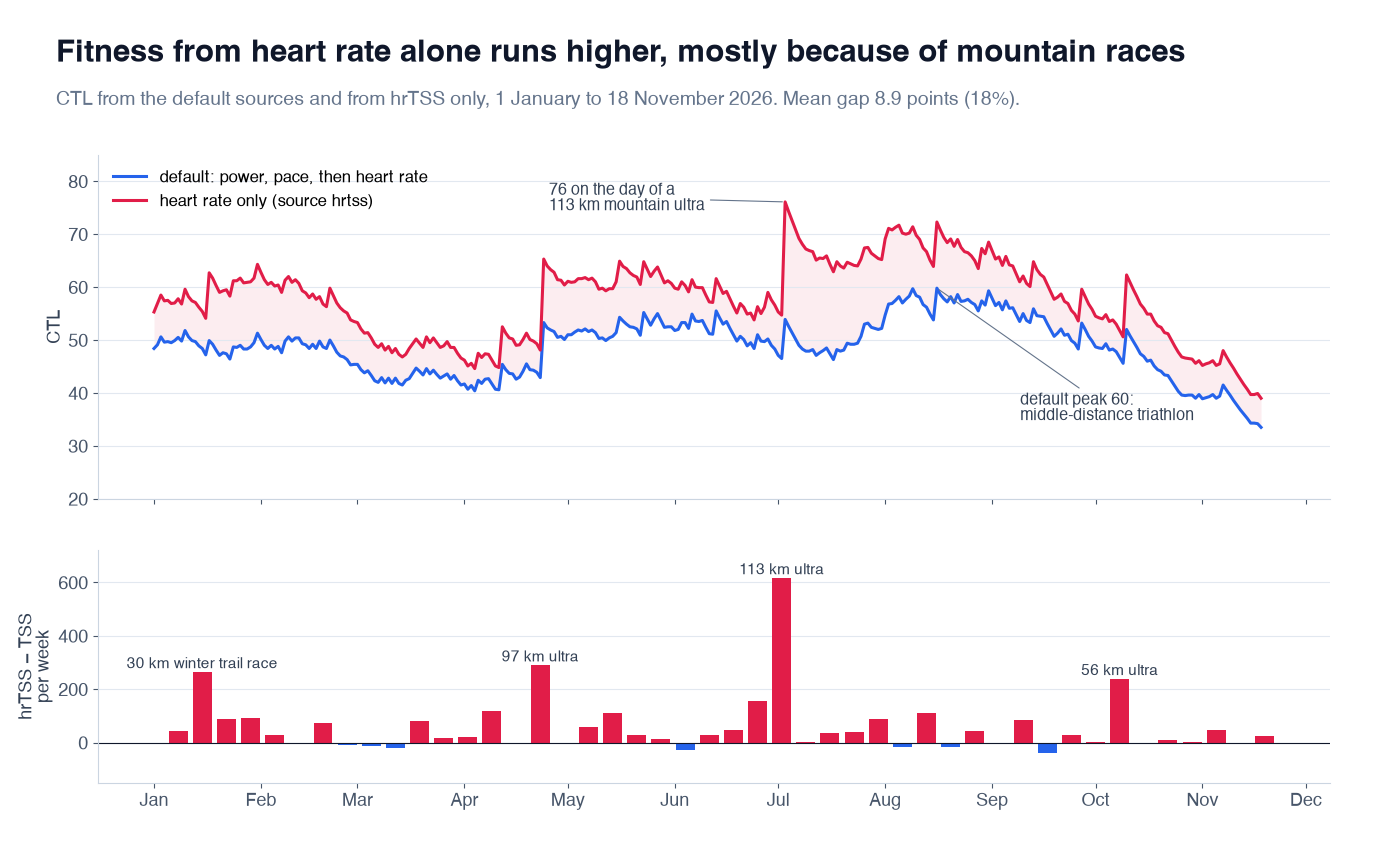 Fitness from the default sources (blue) and from heart rate only (red). Bottom: hrTSS minus TSS per week.
The heart-rate curve ran 8.9 points (18%) higher on average, and the two daily curves correlated at 0.90. They disagree about the summit: from heart rate my fitness peaked at 76 on the day of the 113 km mountain ultra; by default it peaked at 60 on the day of the middle-distance triathlon. The biggest weekly differences were all mountain races.
By kind of session, races added 1,829 points over the season, trail runs 677 and easy indoor rides 419. Interval runs moved it the other way, but barely: long reps −33, short reps −8. Easy runs took off 224. The intervals the documentation warns about were the smallest part of the difference.
The terminal shows the same thing two days after the ultra:
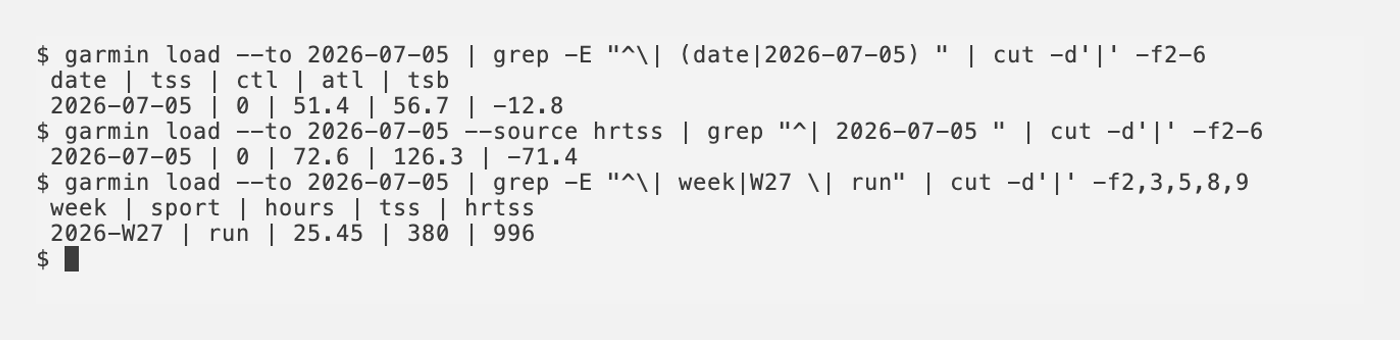
garmin is the command-line companion, npx -y garmin-mcp-cli.
Form is where it shows most. On 5 July the default model said −12.8; the heart-rate model said −71.4. Over the season the heart-rate model was below −30 on 9 days, the default on 2. These are training numbers, not medical advice, but if I had trusted the heart-rate curve that week I would have read the ultra as a much deeper hole than pace did.
What I take from it
- Heart rate lags, and on short efforts the lag is large. Inside a stride it gives half the stress of pace. If you care about the stress of the fast part itself, heart rate is the wrong tool.
- For a whole interval session, it evens out. On my runs, the stress heart rate misses during the reps came back in the recoveries. The extra error over an easy run was about 1%.
- Fix the pace side first. An average pace undercounts intervals by about as much as heart rate does. My rTSS uses Garmin's average; that is the larger bias in my model for interval days.
- The real gaps are terrain and easy rides. Mountain races, trail runs and easy indoor rides moved my season far more than intervals or heat.
Limits
- One athlete, one season. 139 runs and 47 rides, 37 interval runs with second-by-second data, 4 of them with short reps. The heat tests have 26 and 33 sessions.
- Thresholds are Garmin's automatic ones. Running threshold heart rate moved between 161 and 176 bpm across the season; cycling FTP and threshold heart rate are one value from October, used for every ride. Every ratio here depends on both thresholds; the easy-run baseline absorbs part of that, not all of it.
- My normalized pace is an approximation, from Garmin's sampled details (one point every 1 to 4 seconds) and its grade-adjusted pace, not from the FIT file. Where GPS dropped out, pace reads zero for a while.
- Temperature is at the start of the run, from the nearest weather station; indoor temperature is the bike computer's, which sits in front of a fan.
- My categories come from my workout names. They are mine, and a few runs could sit in another group.
Code: https://github.com/endurancetools/garmin-mcp Documentation, including Training analytics and Methods and evidence: https://endurancetools.github.io/garmin-mcp/
Unofficial; not affiliated with or endorsed by Garmin.
Some illustrations in this article were generated with ChatGPT.
 Follow @marcin_running on Instagram